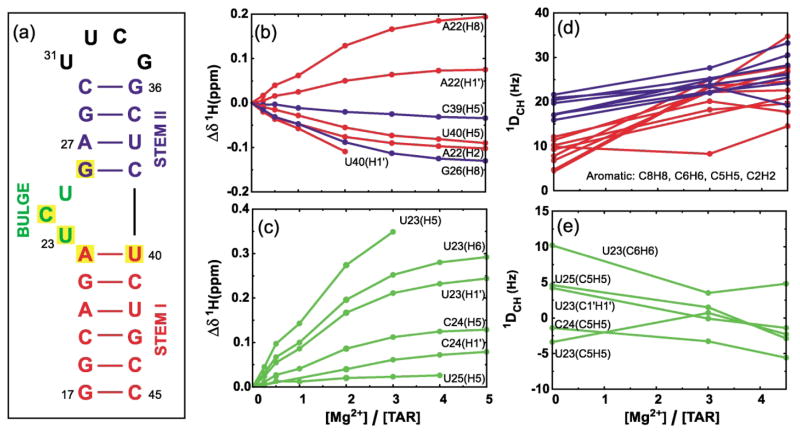
Figure 1.
Secondary structure of the TAR RNA domain and variations in chemical shift and RDCs as a function of [Mg]:[TAR] stoichiometry. (a) The HIV-1 TAR analog used in this study. The six-residue hairpin loop in wt-TAR (CUGGGA) has been replaced with the more stable tetraloop (UUCG). Yellow boxes indicate residues having the largest Mg2+-induced 1H chemical shift perturbations[(Δδ (ppm) = δTAR(Mg) – δTAR(free)) > 0.1 ppm, positive values imply downfield shifts]. Perturbations in 1H chemical shifts for (b) residues in stem I (red) and II (blue) and, (c) bulge residues. RDC values measured between directly bonding C–H nuclei in (d) base moieties of residues in stems I (red) and II (blue) and (e) base and sugar moieties of bulge residues. Uniformly labeled 15N/13C-labeled TAR was prepared using standard procedures as described.21 NMR samples contained ~1.0 mM 15N/13C-labeled TAR, 15 mM sodium phosphate (pH 6.0–6.2), 25 mM sodium sulfate, 0.1 mM EDTA, and 3.0 and 4.5 mM Mg2+ for TAR(3.0 Mg) and TAR(4.5 Mg), respectively. An identical NMR sample also contained ~21 mg/ml of Pf1 phage.34,35 All NMR data were acquired on Varian Inova spectrometers operating at 1H frequencies of 500 and 600 MHz at 25 °C. Resonances were assigned by following incremental shifts upon addition of Mg2+. As described,21 splittings between [C8–H8, C6–H6, C2–H2], [C5–H5], [C1′ –H1′] were measured using 1H and 13C IPAP-HSQC experiments40 and between [C2′ –H2′, C3′ –H3′, C4′ –H4′] using the 1JCH-CT-CE-HSQC experiment.16 RDCs were calculated as the differences between splittings measured in the presence and absence of phage. The uncertainty in RDCs, estimated from measuring splittings in the 1H and 13C dimension, was <3.5 Hz and <4.5 Hz for TAR(3.0 Mg) and TAR(4.5 Mg), respectively. The greater uncertainty in RDCs measured in the presence of Mg2+ relative to TAR(free)21 is attributed to increased line widths arising from greater degree of alignment as well as exchange broadening due to non-specific Mg2+ binding.

