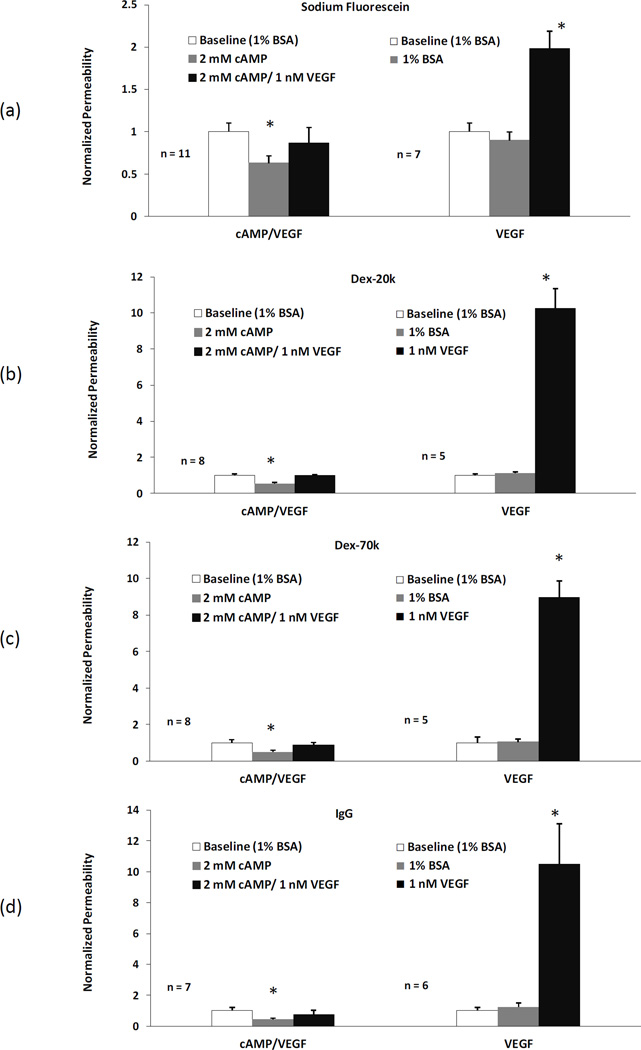
Figure 6.
Comparison of apparent P (mean ± SE) in the test group (20 min pretreatment with cAMP and then VEGF/cAMP), left panel, and that in the control group (no cAMP) , right panel, for (a) sodium fluorescein, (b) Dex-20k, (c) Dex-70k, and (d) IgG. The first bar in each group is the baseline with 1%BSA Ringer perfusion, the second bar in the test group is P after 20 min cAMP treatment and the third bar is P after ~30 sec VEGF/cAMP treatment. For comparison, the second bar in the control group is P after 20 min 1%BSA Ringer and the third bar is P after ~30 sec VEGF treatment. *p < 0.05 compared with the baseline in each group.

