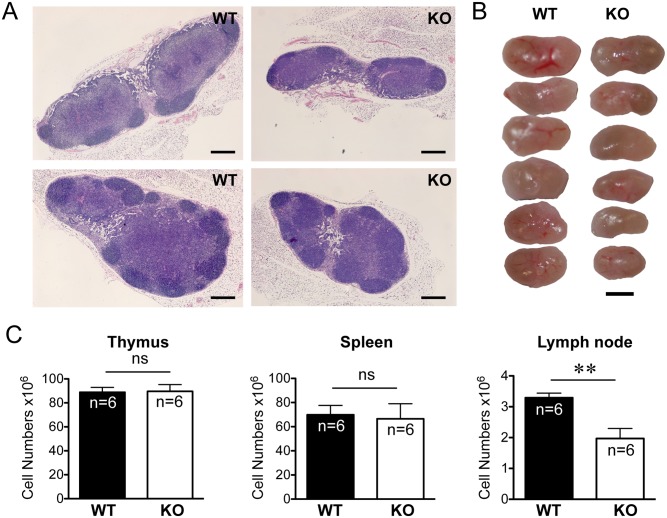
Fig 2. Decreased peripheral lymph organ cellularity in Rras −/− mice.
(A) Hematoxylin and eosin staining of axillary lymph nodes. Bars, 200 μm. (B) Pictures of lymph nodes are shown. Bars, 400 μm. (C) Cell suspensions were prepared from the indicated organs (six in each group) and cellularity was determined by trypan blue exclusion. Data represent at least three independent experiments. Statistical analysis was performed using a two-tailed student’s t test. Bars, SE. ns, no significant difference. **p< 0.005.

