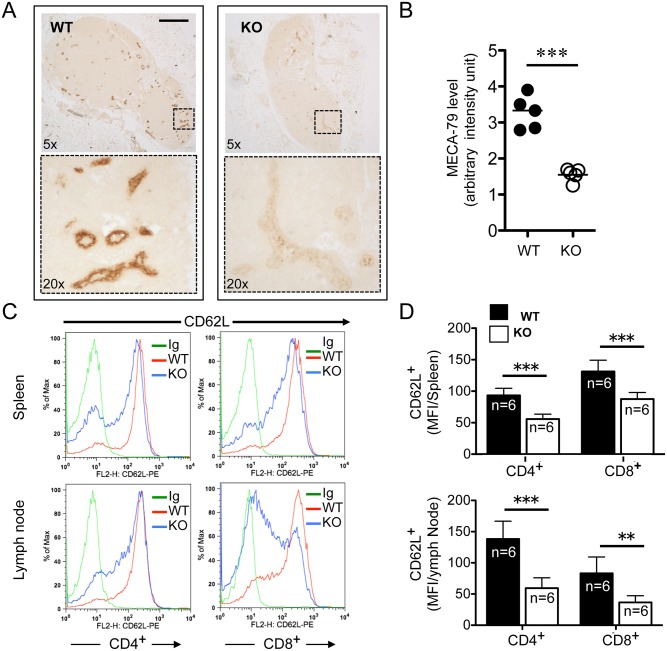
Fig 3. Aberrant lymph nodes in Rras −/− mice.
(A) Immunohistochemical analysis of Rras +/+ (WT) and Rras −/− (KO) lymph nodes stained with anti-MECA-79 (brown). Magnified areas (boxed) are shown in lower panels. Bars, 200 μm. (B) Staining intensity was quantified from five lymph nodes. Bars, means. ***p<0.0001, t-test. (C) Surface expression of CD62L in CD4+ and CD8+ T cells from spleen and lymph nodes (LN) of Rras +/+ and Rras −/− mice was analyzed with flow cytometry. Isotype immunoglobulin (Ig) was used as a control. (D) The results from six mice per group were quantified and depicted. Bars, SD, two-tailed t-test. **p<0.005, ***p<0.0001.

