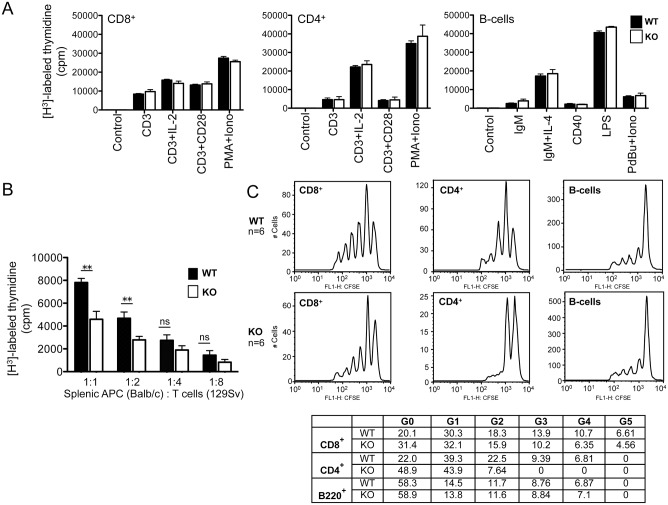
Fig 4. Attenuated T cell proliferation in Rras −/− mice.
(A) T and B lymphocytes were stimulated with the indicated immune regulators and cell proliferation was measured by thymidine incorporation techniques. Results from triplicate measurements using two mice per group. Bars, SD. Abbreviations, IL-2, interleukin-2; PMA, phorbol myristate acetate; Iono, ionomycin; interleukin-4, IL-4; LPS, lipopolysaccharide; PdBU, phorbol 12, 13-dibutyrate. (B) Mixed lymphocyte reaction assays were carried out by co-mixing T cells from either Rras +/+ (solid bars) or Rras −/− (open bars) mice in 129Sv strain with T cell-depleted splenic antigen-presenting cells from WT Balb/c mice at the indicated ratios. T cell proliferation was assessed 4 days later with the [H3]-thymidine incorporation method. Results represent triplicate measurements from a single experiment that was reproduced twice. Bars, SD. ns, no significant difference. **p< 0.005. (C) In vivo proliferation of splenocytes was conducted by the dye dilution method. Sublethally irradiated naïve C57BL/6 mice were infused with 8 to 10 × 106 of CFSE labeled total splenocytes from either Rras +/+ (WT) or Rras −/− (KO) mice. After 14 days, spleens were collected for dye dilution assays followed by flow analysis. Representative data are shown with six per group. The relative cell numbers (%) in individual peaks are shown in the table.

