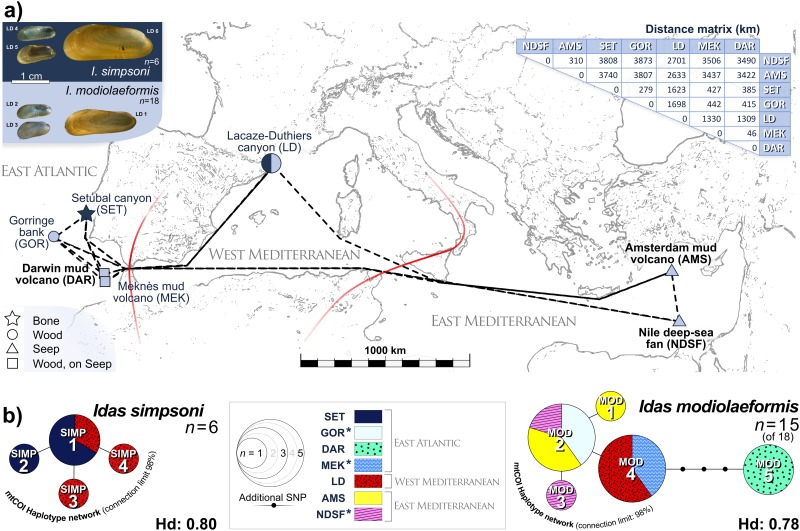
Fig 1. Map of the study region and mitochondrial-COI haplotype distribution.
a) Presence/absence of Idas simpsoni (navy) and I. modiolaeformis (pale blue), habitat type and inter-site distances are depicted for the 7 sites, which span three oceanographic regions (demarcated by red lines). Sites where seepage was visibly active (e.g. turbulent flow / bubbling from sediments) are labelled in bold black. Distance matrix relates to dashed-line trajectories, measured in Google Earth™. Example micrographs of both hosts (top-left) are specimens LD 1–6, from LD. b) The mtCOI haplotype networks for I. simpsoni and I. modiolaeformis are displayed (see central legend). Sequences of adjacent haplotypes differed by a single nucleotide polymorphism (SNP). Diameters represent overall haplotype frequencies, subdivided by site location, where applicable. Hd- Haplotype diversity; 1 SNP = 0.4% K2P distance (257bp). Asterisks indicate sites where COI was analysed in 2 of 3 hosts only. For sample/site details, see Table 1 and main text. Base map redrawn from a Google Earth™ image.

