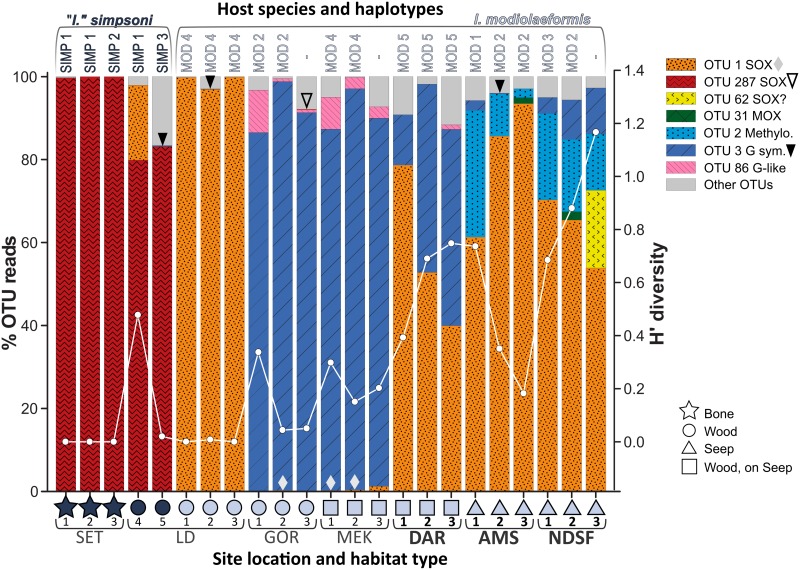
Fig 3. Percentage contributions of principal OTUs and the Shannon-Weiner diversity index (H’).
Corresponding number of reads for principal OTUs available in S1 Table. Diamonds (bottom) and arrowheads (top) identify lowest abundances not visible as bars (corresponding OTUs in legend). Overlaid line plot is H’ diversity of symbionts. Haplotypes (above) and site details (below, see legend) are indicated (N.B. COI in 3 of 18 Idas modiolaeformis not analysed). Visibly active sites are in bold. Analyses exclude mussel LD 6, which was probably moribund (see main text).

