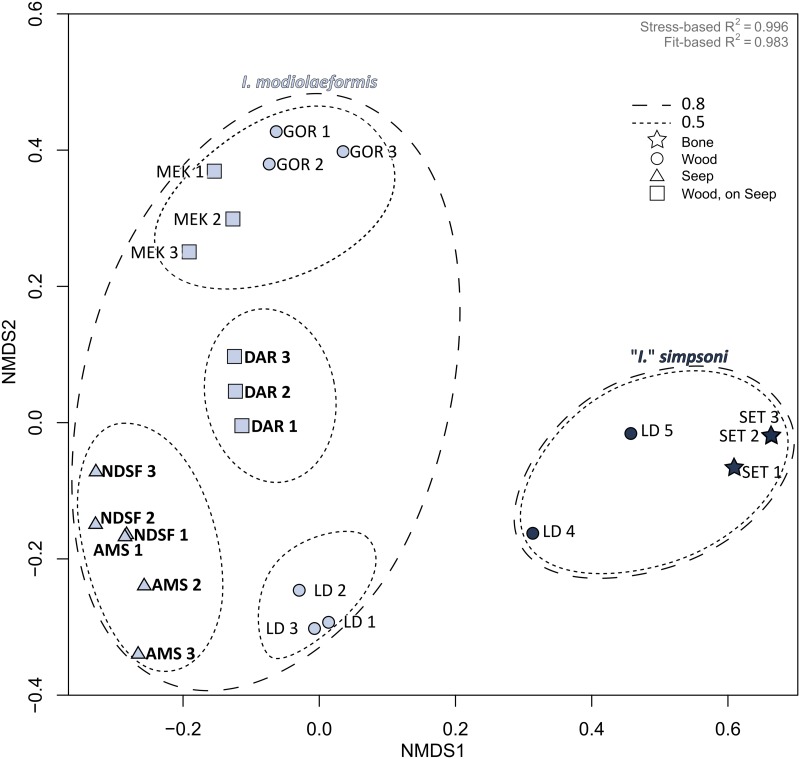
Fig 4. nMDS ordinance plot of bacterial assemblages in Idas modiolaeformis and I. simpsoni.
A BC dissimilarity-matrix derived from no. reads for each OTU per host was used to plot nMDS. Symbol shapes indicate HABITAT (see legend). Light blue = I. modiolaeformis; navy = I. simpsoni. Superimposed ellipses correspond to the 0.5 and 0.8 heights of a separate cluster analysis (see S1 Fig). Visibly active sites are in bold.

