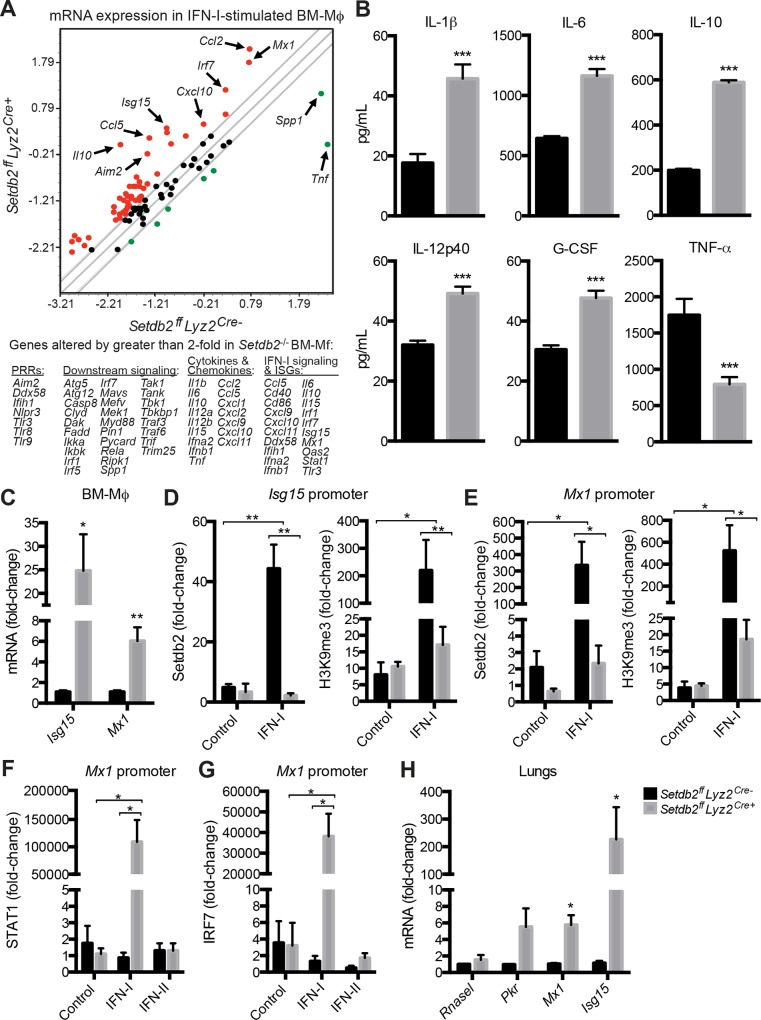
Fig 5. Setdb2 suppresses the expression of antiviral genes and cytokine production nu BM-Mϕ.
Gene expression (A, C) and cytokine production (B) by control and Setdb2 -/- BM-Mϕ stimulated with IFN-I for 24 hours. Data represents the mean ± SEM of 3 independent experiments. (A) Comparison of antiviral and proinflammatory genes by RT-PCR. Values on scatter plot represent log10 (ΔCt). The gray lines represent a 2-fold change in gene expression; upregulated genes (red dots), downregulated genes (green dots). (B) Concentration of IL-1β, IL-6, IL-10, IL-12p40, G-GSF, and TNF-α in the supernatants of control and Setdb2 -/- BM-Mϕ. (C) RT-PCR of Isg15 and Mx1. Data were normalized to control BM-Mϕ. (D-G) Control and Setdb2 -/- BM-Mϕ were treated with a vehicle control, IFN-I (D-G), or IFN-II (F, G) for 24 hours. Data are mean ± SEM relative to IgG control; n = 2–3 experiments (D, E) ChIP analysis of Setdb2 binding and H3K9 tri-methylation in the Isg15 (D) and Mx1 (E) promoter. (F, G) ChIP analysis of STAT1 (F) and IRF7 (G) binding in the Mx1 promoter. (H) Control and Setdb2 ff Lyz2 cre+ mice inoculated with a sublethal dose of IAV (1 x 10⁴ PFU).) RT-PCR of Rnasel, Pkr, Mx1, and Isg15 in infected lungs on day 4 post-infection. Data are mean ± SEM (n = 6–14 mice) from 2–3 independent experiments. *p<0.05; **p<0.01; ***p<0.001.

