
Fig. 4.
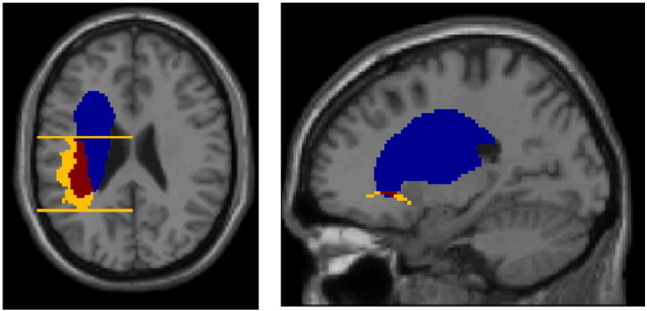
Two examples of divergence between lesion load and disconnection. (Left) High lesion load (45%) in the arcuate fasciculus but without disconnection; this figure includes two of three ‘bookends’ used to delineate the fascicle's most posterior and anterior extents. (Right) Disconnection of the uncinate fasciculus with only 5.5% lesion load. Colour code: blue = lesion; yellow = tract/tract ‘bookend’; red = intersection between lesion and tract.