
Figure 1. Immunocytochemistry of hMSC stimulated with FGF2 during expansion phase and gene expression during expansion and in vitro chondrogenesis.
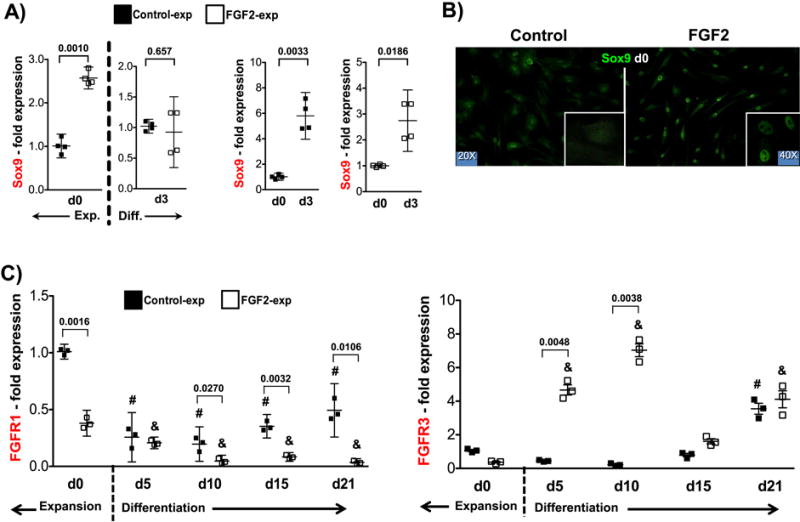
(A) Sox9 mRNA (n=4) at the end of 14 days of expansion (Exp. - d0) and at early chondrogenic differentiation in aggregate cultures (Diff. – d3) with and without FGF2. Statistical comparisons made against control-expanded data at d0 and d3 independently (left panel) and against d0 for both groups (right panel). (B) Sox9 protein at the end of 14 days of expansion in control and FGF2-rich medium. (C) FGFR1 and FGFR3 (n=3) gene expression profiles (assessed by qRT-PCR) evaluated after 14 days of expansion (d0) and subsequent aggregate culture for 21 days. (#): Statistical significance (p<0.0001) when data compared to control-expanded at d0; (&): Statistical significance (p<0.0001) when data compared to FGF2-expanded at d0. Statistical significances (p values) when Control and FGF2-expanded cells are compared at a particular time-point are shown in the graph for clarity. Gene expression analysis was performed for all four donors (Sox9) and three donors (FGFRs) using triplicate samples.