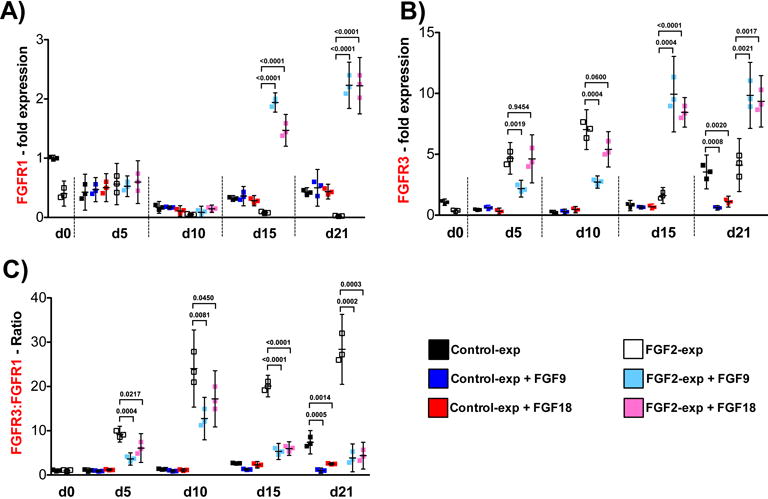
Figure 2. FGFR3, FGFR1 gene expression and FGFR3:FGFR1 ratio during hMSC chondrogenic differentiation in the presence of FGF9 and FGF18.

Control and FGF2-expanded cells (n=3) were subjected to FGF9 or FGF18 stimulation from d0 to d21 of differentiation induction in pellet cultures, where d0 data corresponds to expanded cells just before aggregate formation. Pellet cultures were harvested at day 5, 10, 15 and 21, and qRT-PCR performed to evaluate FGFR3 and FGFR1 gene expression (A & B) and FGFR3:FGFR1 ratio (C). Results with non-stimulated Control (black dots) and FGF2-expanded cells (white dots) are shown again as in Fig 1C for reference (statistical differences presented in Fig 1C). Data obtained at every time point with FGF9 and FGF18 stimulation were compared with Control-expanded and FGF2-expanded cells at the same point, and the statistical differences (p values) shown in the graph for clarity. All other comparison were p>0.1.
