
Figure 3. Chondrogenic differentiation of FGF2-expanded hMSC in the presence of FGF9 or FGF18 (and variants) at different times of initial stimulation.
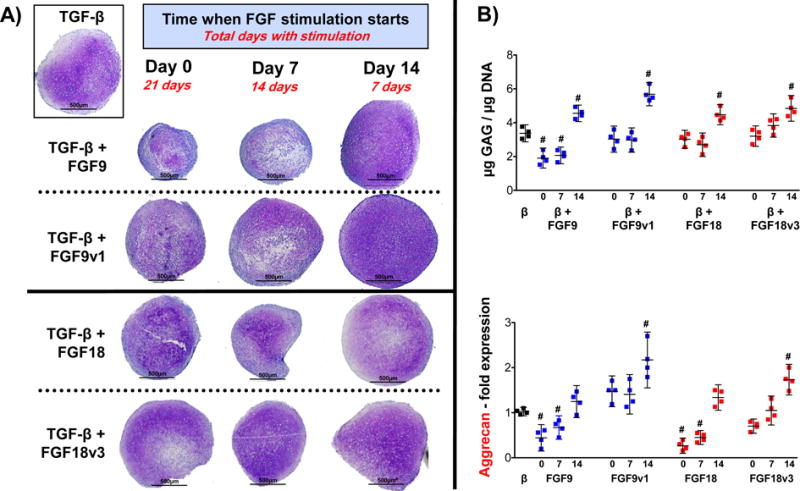
FGF9, FGF18 or their variants were administered starting at the beginning (d0), at day 7 (d7) and at day 14 (d14) of chondrogenic differentiation until day 21. (A) Histological assessment of representative pellets showing the anabolic effect when stimulation starts at d14, and a negative effect when started earlier, specifically FGF9. Pellet shown in the insert (control) corresponds to black dots shown on B). (B) GAG/DNA quantification and aggrecan gene expression analysis assessed by qRT-PCR, performed at day 21. Statistical significance (#) was obtained for GAG/DNA comparing all values to control pellet (black dots) with the following p values: β+9 (d0: 0.0010; d7: 0.0011; d14: 0.0017); β+9v1 (d14: 0.0001); β+18 (d14: 0.0021); β+18v3 (d14: 0.0008). All other comparisons were p > 0.2. For Aggrecan, significance (#) gave the following p values: β+9 (d0: 0.0009; d7: 0.0021); β+9v1 (d14: 0.0011); β+18 (d0: <0.0001; d7: <0.0001); β+18v3 (d14: 0.0007). All other comparisons were p > 0.2. N=4.