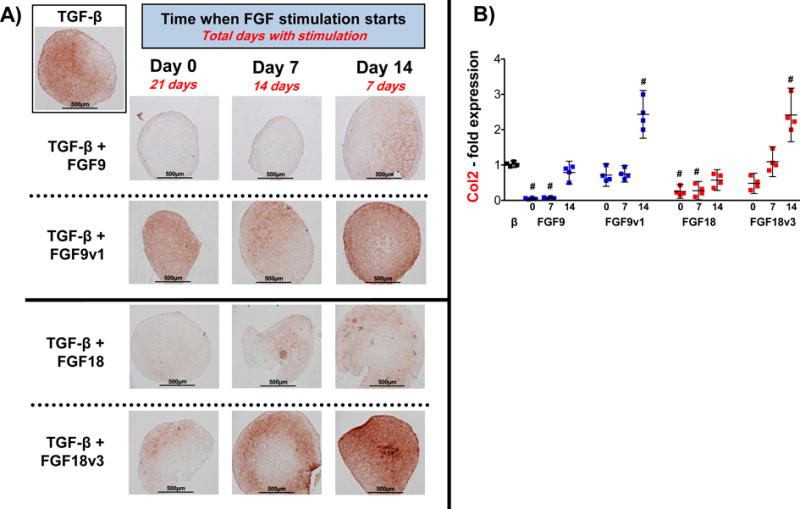
Figure 4. Type 2 collagen Immunohistochemistry and gene expression of FGF2-expanded hMSC in the presence of FGF9 or FGF18 (and variants) at different times of initial stimulation.

Type 2 collagen presence in pellets subjected to same conditions as in Figure 3, assessed at day 21 by immunohistochemistry (A) and qRT-PCR (B). Statistical significance (#) was obtained comparing all values to control pellet (black dots) with the following p values: β+9 (d0: <0.0001; d7: <0.0001); β+9v1 (d14: 0.0006); β+18 (d0: <0.0001; d7: <0.0001); β+18v3 (d14: 0.0012). All other comparisons were p > 0.2. N=4.
