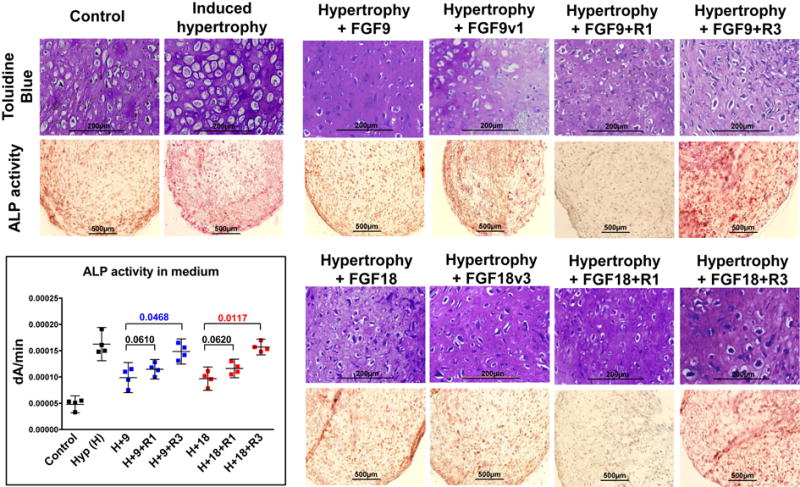
Figure 7. FGF9 and FGF18 delay induced hypertrophy-related features.

Induced terminal differentiation of FGF2-expanded hMSC evaluated cytomorphologically6,7 (top row) and by the activity of the hypertrophy-specific marker Alkaline Phosphatase (ALP) in sections (lower row) and quantified (dA/min = changes of Absorbance at A405 in time within the linear range) in the medium6 (insert). Compared to control, all conditions with hypertrophy induction are statistically different (p<0.0001). Compared to hypertrophy alone (H): the addition of FGF9 (p=0.0441) and FGF18 (p=0.0280) delayed the appearance of those enhanced terminal differentiation characteristics. Blocking FGFR3 prevented this effect (with FGF9: p=0.1975, and with FGF18: p=0.4863), while blocking FGFR1 did not (with FGF9: p=0.0459, and with FGF18: p=0.0478). This effect of blocking the receptors is further supported when compared to the growth factors alone: p values shown in graph for clarity and significant differences displayed in color. N=4.
