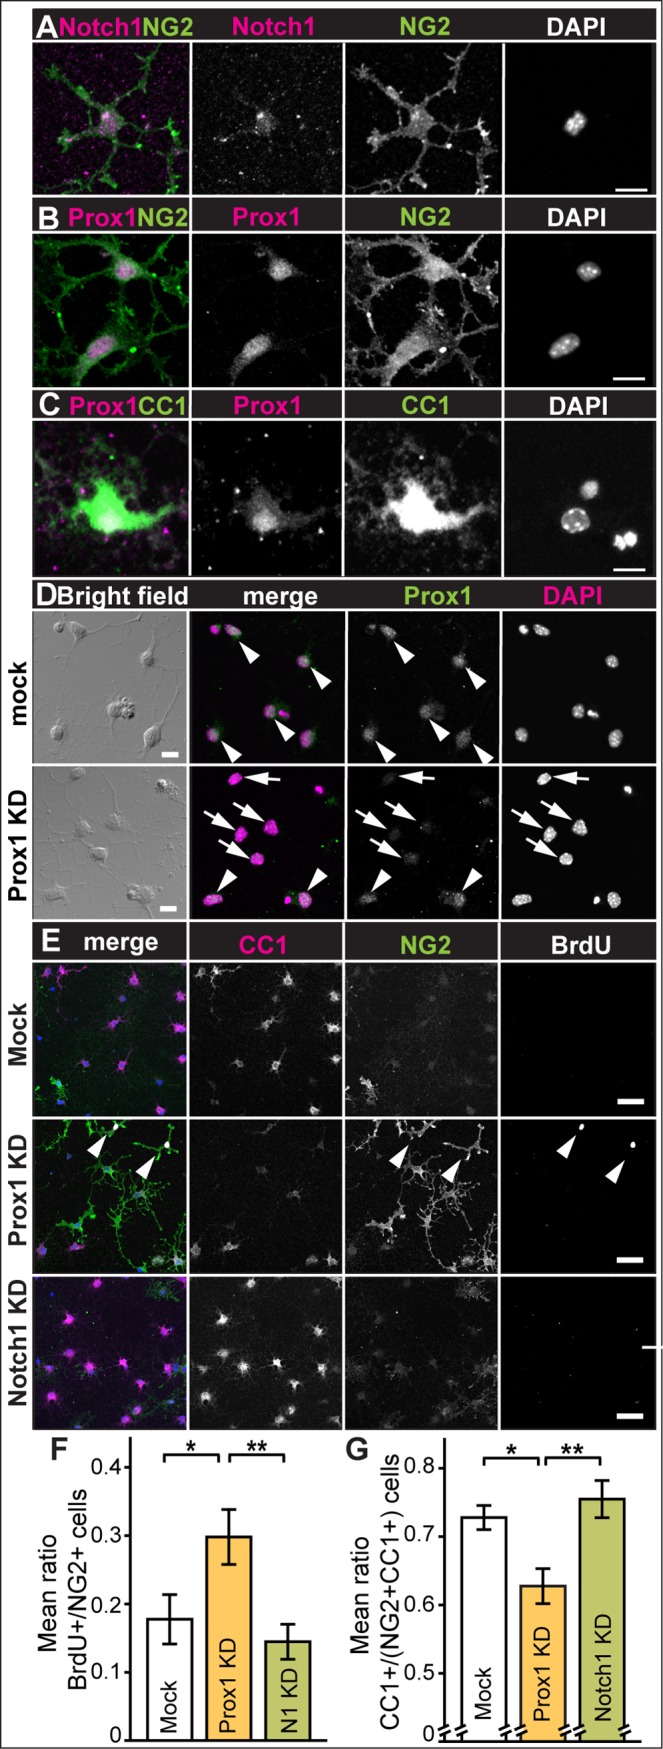
Fig 2. Prox1 inhibits proliferation and is required for differentiation of primary OPCs.

Immunostaining of primary OPCs showing that NG2+ OPCs are (A) Notch1+, note that this anti-Notch1 antibody also detects nuclear NotchICD and (B) Prox1+. (C) Prox1 is present in CC1+ OLs. (D, E) Prox1 knockdown by siRNA reduces OL differentiation. (D) Control mock-transfected cells have Prox1, whereas in prox1-siRNA transfected cells some OPCs retain Prox1 (arrowheads), other cells have dramatically reduced Prox1 (arrows). (E-G) In differentiation medium, control mock-transfected primary OPCs became mostly CC1+ differentiated OLs, whereas transfection with prox1-siRNA (Prox1KD) increased the proportion of NG2+BrdU+ cells, and transfection with Notch1-siRNA (Notch1KD) increased the proportion of CC1+ cells (E). (F,G) Quantifications: (F) mean number of BrdU+ amongst NG2+ cells, in control cells (mock) and upon transfection of Prox1-siRNA (KD: knockdown) or Notch1-siRNA (N1 KD). (G) Mean ratio of CC1+ cells over the total cells (NG2+ CC1+) in control cells (mock) and cells transfected with Prox1-siRNA (KD: knockdown) or Notch1-siRNA (KD). Error bars represent standard error of the mean; asterisks: *p<0.05, **p<0.01. One Way ANOVA p<0.05, followed by Bonferroni post-hoc multiple comparison corrections. Sample sizes: mock: n = 9; Prox1-siRNA: n = 10; Notch1-siRNA: n = 9. Scale bars: (A-D) 10mm, (E) 50mm.
