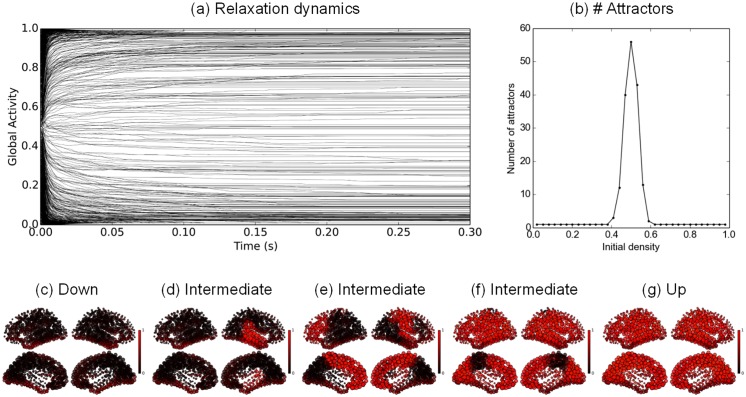
Fig 2. Hopfield graded-response connectome dynamics.
a: Time course of the average network activity after 1,000 different random initializations. b: Distribution of the number of attractors depending on the initial density activity. c–g: Example final activation patterns: c is obtained for an initial density f 0 = 0.02, d–f for f 0 = 0.5 and g for f 0 = 0.98. P = 1, G = 900.

