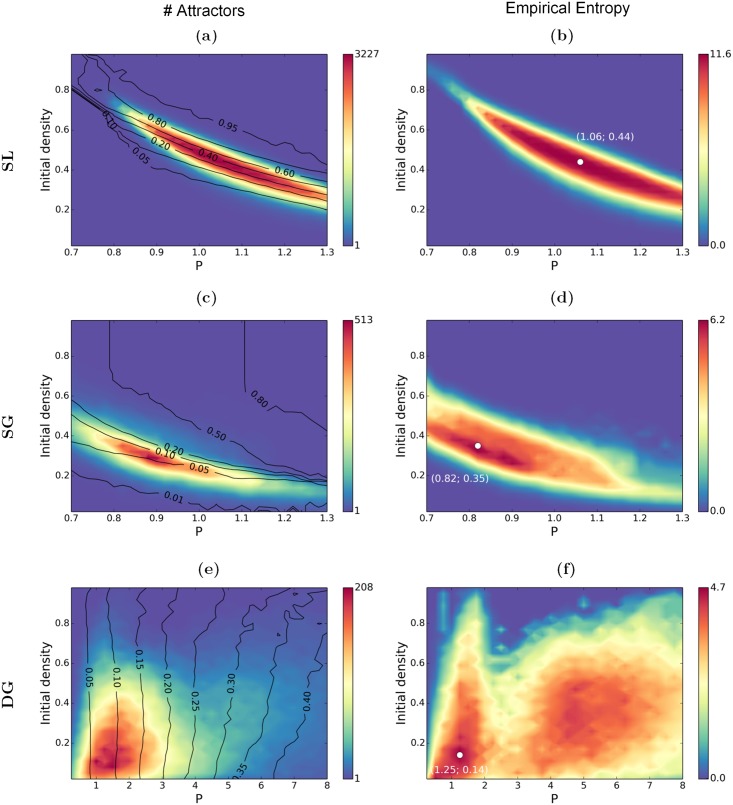
Fig 5. Number of attractors (left) and empirical entropy (right) in function of the scaling factor P and the initial density f 0.
3,300 initial conditions are randomly sampled for each value of (P, f 0). Black lines are isodensity lines corresponding to the average density of attractors. a-b: SL model. c-d: SG model. e-f: DG model. The white dots in b, d, f report the coordinates of the maximal value. G = 900.

