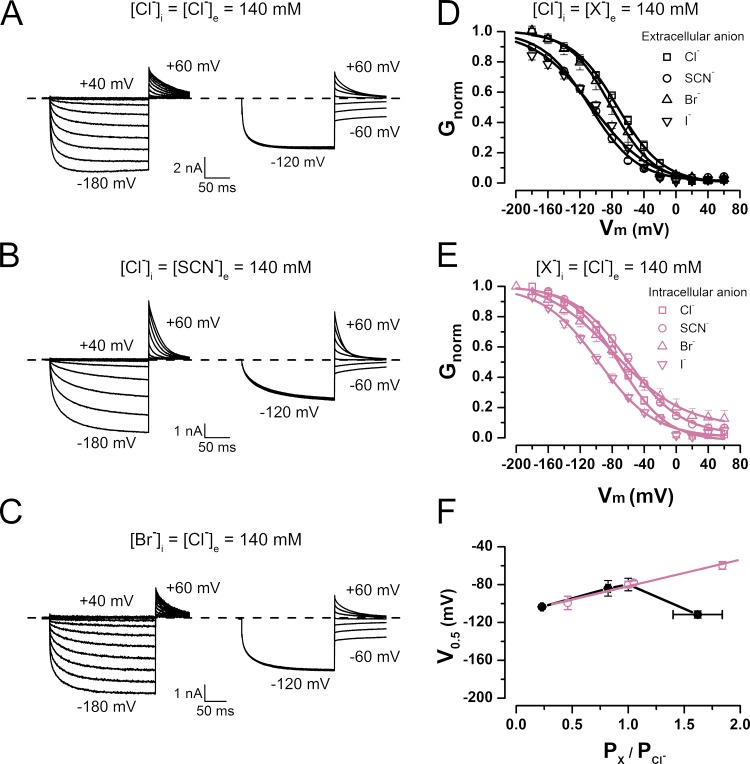
Figure 1.
Asymmetric regulation of CLC-2 voltage-dependent activation by permeant anions. (A–C) Examples of whole-cell ICl(t) (left) and Itail(t) (right) recorded in the presence of [Cl−]i = [Cl−]e = 140 mM (A), [Cl−]i = [SCN−]e = 140 mM (B), and [Br−]i = [Cl−]e = 140 mM (C). pHe = pHi 7.3. Cells were held at 0 mV. ICl(t) was recorded between −200 and 40 mV in 20-mV increments and repolarized to 60 mV; Itail(t) was recorded between −60 and 60 mV in 20-mV increments after pulse activation of −120 mV. (D) Gnorm(Vm) curves obtained from cells bathed in solutions containing 140 mM of permeant anions Cl−, SCN−, Br−, or I−. V0.5 and z values yielded by data fits to a Boltzmann equation (continuous lines) are Cl− (squares), −79.9 ± 6.6 mV and −0.94 ± 0.01 (n = 28); SCN− (circles), −111.3 ± 3.8 mV and −1.05 ± 0.06 (n = 5); Br− (upright triangles), −94.3 ± 8.2 mV and −0.98 ± 0.02 (n = 5); I− (inverted triangles), −103 ± 2.3 mV and −0.92 ± 0.01 (n = 5). [Cl−]i = 140 mM, and pHe = pHi 7.3. (E) Gnorm(Vm) curves obtained from cells dialyzed with solutions containing permeant anions Cl−, SCN−, Br−, or I−. Data were fitted as described for B, yielding the following V0.5 and z values: Cl− (squares), −79.9 ± 6.6 mV and −0.94 ± 0.01 (n = 28); SCN− (circles), −59.8 ± 4.1 mV and −0.70 ± 0.03 (n = 6); Br− (upright triangles), −78 ± 2 mV and −0.58 ± 0.05 (n = 12); I− (inverted triangles), −99.4 ± 7.0 mV and −0.68 ± 0.01 (n = 4). [Cl−]e = 140 mM, and pHe = pHi 7.3. (F) V0.5 versus PX/PCl relationship in Vm-dependent activation of CLC-2 in the presence of extracellular and intracellular permeant anions (black and reddish purple symbols, respectively). Continuous line is regression line. Error bars represent mean ± SEM.

