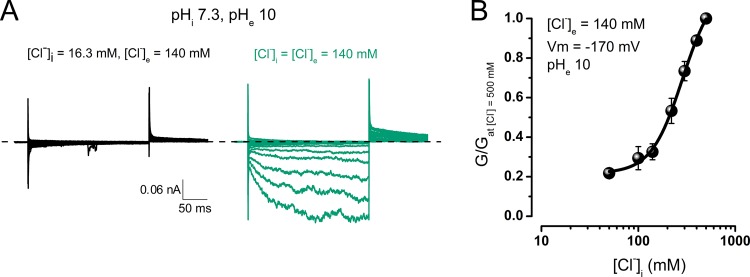
Figure 6.
Activation of CLC-2 by hyperpolarization in excised patches exposed to increasing [Cl−]i at extracellular pH 10. (A) Macroscopic ICl(t) recorded from an inside-out patch excised from an oocyte expressing rCLC-2-Δ13-36. The intracellular side of the patch was exposed first to 16.3 mM [Cl−]i (black) and then to 140 mM (bluish green). [Cl−]e was 140 mM, and pHe and pHi were set to 10 and 7.3, respectively. (B) [Cl−]i dependence of CLC-2 activation. ICl(t) was measured at −170 mV in solution with pHe 10 and converted to macroscopic conductance (G). At each [Cl−]i, G is normalized by G obtained in 500 mM [Cl−]i (n = 5). Error bars represent mean ± SEM.

