Figure 7.
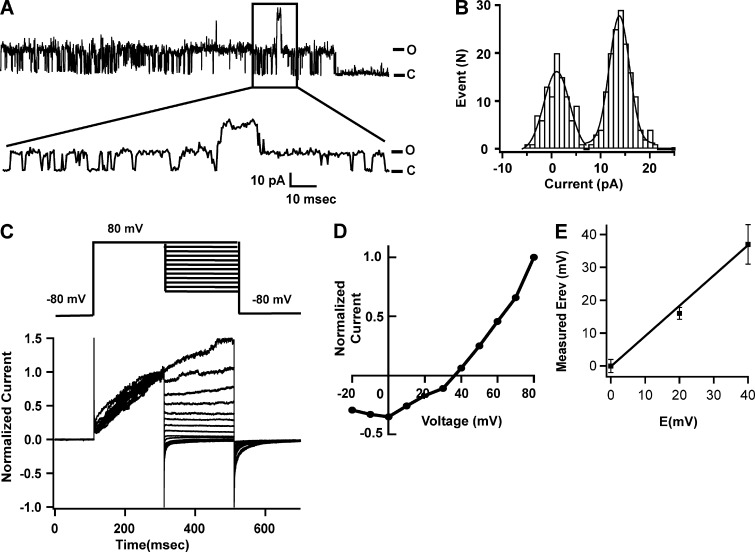
Electrophysiological properties of KvAP channels in bSUMs. (A) Single-channel activity at 80 mV. The windowed part was expanded and shown underneath. C, closed state; O, open state. There were at least two channels. The rareness of double openings suggested that the open probability at 80 mV was <50%. (B) Histogram of single-channel events at 80 mV. The peak value of the first channel opening is 14.3 ± 0.1 pA, and the baseline peak is 1.6 ± 0.3 pA based on Gaussian fitting. The calculated single-channel conductance is 174 ± 5 pS. (C) A typical series of current traces recorded from bSUMs using the pulse protocol is shown on the top. The bSUMs were prepared with solutions that set the Nernst potential for K+ ions (Ek) to 0 mV. After depolarization to 80 mV for 200 ms, tail currents were measured at various potentials (−20 to 80 mV). For every trace, the leak conductance estimated at −80 mV was applied to all segments for leak subtraction. Only traces with very small or no leaks were used for analysis. The averaged tail currents during the first 20 ms of repolarization at various potentials were normalized against that at 80 mV and then used to make an I-V plot. A linear fitting around I = 0 was used to estimate the reversal potential. (D) A normalized I-V plot for Ek = 40 mV is shown as an example. The reversal potential was found to be ∼38 mV. (E) Measured reversal potentials against Ek in various potassium solutions. Each data point represents the average of two to four experiments, and the error bars represent the range of variation (n = 2 for 20 mV) and the standard deviations (n > 2 for 0 and 40 mV). The line represents a fitting with y = a x, yielding a = 1.07 ± 0.1. The solutions used in these panels are listed in Table 1, with liquid junction potentials measured three times for each pair of solutions in a planar lipid bilayer setup.

