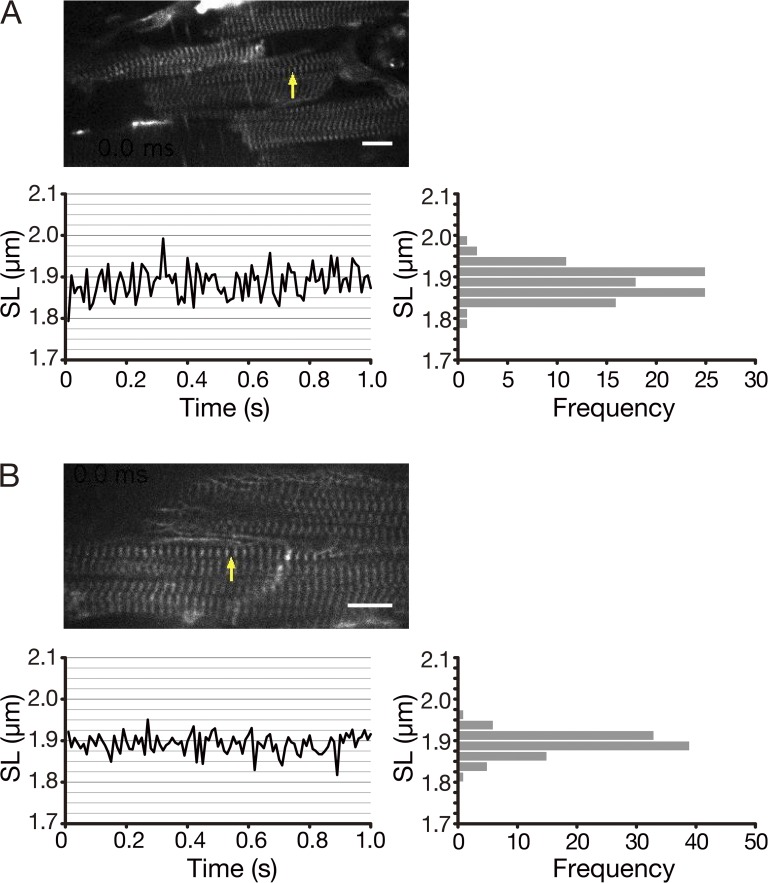
Figure 2.
Fluctuation analysis for the length of a single sarcomere in a myocyte in an isolated perfused heart at rest. (A; top) Ventricular myocyte expressed with α-actinin–AcGFP in Z-disks in the isolated heart at rest observed with a 40× lens (N/A, 0.80). (Bottom left) Time course of the change in SL. Imaging performed at 100 fps. (Bottom right) Histogram showing the variance of SL. SD (i.e., an index of single SL displacement resolution; see Serizawa et al., 2011; Shintani et al., 2014, 2015), 40 nm. Yellow arrow, sarcomere used for the SL analysis. (B; top) Ventricular myocyte expressed with α-actinin–AcGFP in Z-disks in the isolated heart at rest observed with a 60× lens (N/A, 1.00). (Bottom left) Time course of the change in SL. Imaging performed at 100 fps. (Bottom right) Histogram showing the variance of SL. SD, 20 nm. In A and B, the hearts were perfused with Ca2+-free HEPES-Tyrode’s solution containing 80 mM BDM with little or no LV cavity pressure, hence in diastasis (Inoue et al., 2013). Yellow arrow, sarcomere used for the SL analysis.

