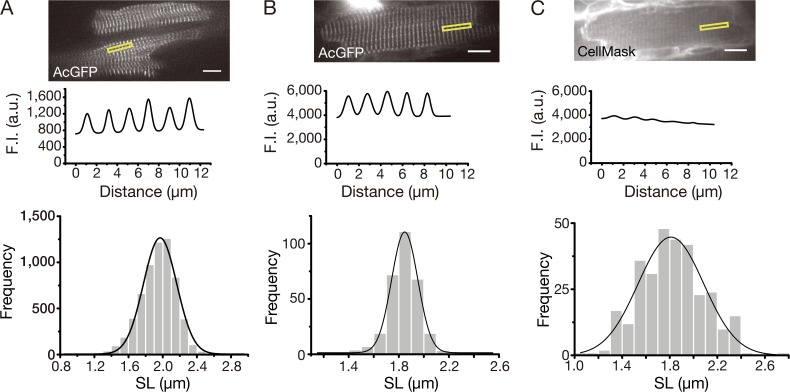
Figure 3.
SL variance in myocytes in isolated perfused hearts at rest. (A; top) Typical confocal image of a myocyte expressed with AcGFP in Z-disks via ADV injection. Same as in Fig. 1 C, right. Sarcomeres in the yellow rectangular outline were used for the analysis in the middle trace. Bar, 10 µm. (Middle) Plot profile in the yellow rectangular outline in top. SL, 1.97 ± 0.22 µm. (Bottom) Frequency plot showing SL in myocytes expressed with AcGFP. Data fitted by a single Gaussian function (peak value, 1.97 ± 0.20 µm). Number of sarcomeres analyzed, 6,281 (in 50 myocytes from three hearts). The hearts were perfused with Ca2+-free HEPES-Tyrode’s solution containing 80 mM BDM (hence in diastasis; see Inoue et al., 2013), and the myocytes were observed by using appropriate emission filters (see Materials and methods). (B) Striation patterns with AcGFP expression. (Top) Typical confocal image of a myocyte expressed with AcGFP in Z-disks via ADV injection. After isolation, the heart was treated with CellMask according to our previously published procedure (Inoue et al., 2013). Note clear striation patterns along the myocyte (compared with those with CellMask treatment in C). Sarcomeres in the yellow rectangular outline were used for the analysis in the middle trace. Bar, 10 µm. (Middle) Plot profile in the yellow rectangular outline in top. Striation spacing distance (i.e., SL), 1.81 ± 0.05 µm. (Bottom) Frequency plot showing striation spacing distance (i.e., SL) in myocytes expressed with AcGFP. Data fitted by a single Gaussian function (peak value, 1.85 ± 0.10 µm). Number of sarcomeres analyzed, 307 (in seven myocytes from two hearts). (C) Striation patterns with CellMask treatment. (Top) Typical confocal image of a myocyte stained with CellMask at the T-tubules (Inoue et al., 2013). Bar, 10 µm. (Middle) Plot profile in the yellow rectangular outline in top. Striation spacing distance, 1.82 ± 0.13 µm (P > 0.05 compared with the data in B, middle). (Bottom) Frequency plot showing the variance of striation spacing distance in myocytes treated with CellMask. Data fitted by a single Gaussian function (peak value, 1.81 ± 0.29 µm). Number of sarcomeres analyzed, 307 (in seven myocytes from two hearts). In both B and C, the hearts were perfused with Ca2+-free HEPES-Tyrode’s solution containing 80 mM BDM. And the AcGFP-expressing hearts were treated with CellMask to compare fluorescence intensity between AcGFP and CellMask. The images in B and C were obtained from a different myocyte than that in A.

