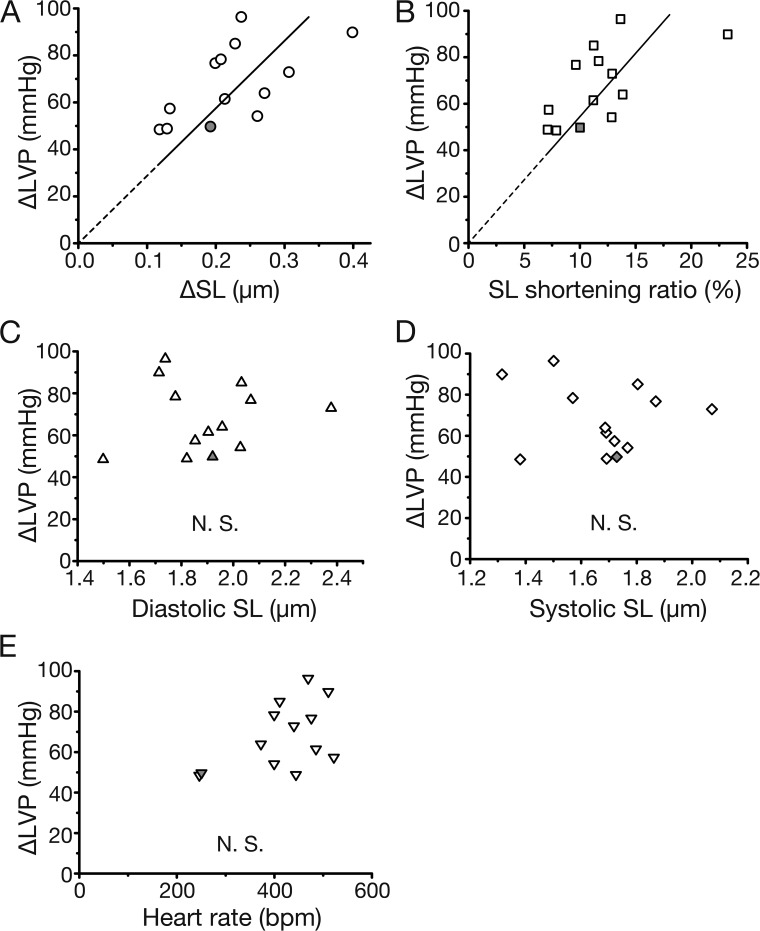
Figure 5.
Relationships of ΔLVP versus various parameters. (A) Relationship between ΔSL and ΔLVP from the animals in Fig 4 E. Each plot was obtained from one animal with the average values of ΔSL and ΔLVP (analyzed from 10–30 cardiac cycles). A significant positive correlation (Y = 287.3X) was present (P < 0.05; R = 0.60). (B) SL shortening ratio (%) plotted against ΔLVP. The shortening ratio was obtained by ΔSL (diastolic SL minus systolic SL) divided by diastolic SL. A significant positive correlation (Y = 5.4X) was present between parameters (P < 0.05; R = 0.62). (C) Diastolic SL plotted against ΔLVP. No significant correlation existed between parameters. (D) Systolic SL plotted against ΔLVP. No significant correlation existed between parameters. (E) HR plotted against ΔLVP. No significant correlation existed between parameters. Number of animals, 13. In all panels, gray symbols indicate the data obtained from the animal in Fig. 4, A–D.

