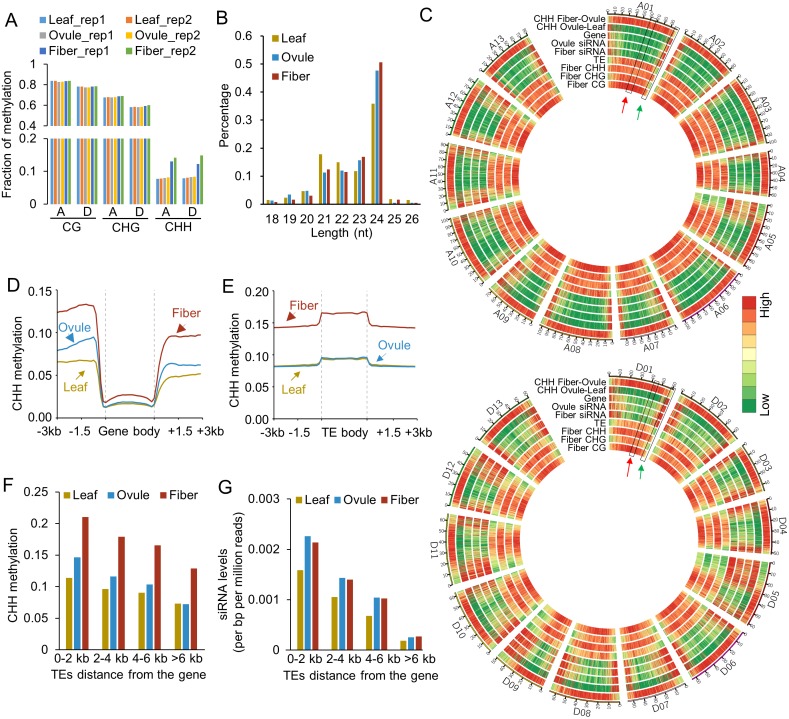
Fig 1. Effects of DNA methylation on ovule and fiber development and genome-wide distribution of DNA methylation in leaves, ovules, and fibers.
(A) Percentage of methylated cytosine (mC) in leaves, ovules (0 DPA), and fibers (14 DPA). A and D indicate A- and D subgenomes in the allotetraploid cotton, respectively. (B) Size distribution of small RNAs in different tissues. (C) Circle plots of fiber CG, CHG, CHH methylation, fiber small RNA density, gene density, TE density, and ovule-leaf and fiber-ovule CHH methylation using 100-kb windows among 13 A-homoeologous chromosomes (upper) and 13 D-homoeologous chromosomes (lower). Color bars indicate low (green) to high (red) densities or intensities. The scales are: fiber CG and CHG methylation level: 0–1; fiber CHH methylation level: 0–0.18; TE density: 0–70%; Gene density: 0–20%; siRNA density in fiber and ovule: 0–60 reads per million reads; Ovule-fiber CHH methylation: 0–0.01; fiber-ovule CHH methylation: 0–0.07. (D) Distribution of CHH methylation in genes. (E) Distribution of CHH methylation in TEs. (F) CHH methylation levels in TEs relative to the distance from the nearest gene. (G) siRNA levels (per bp per million reads) in TEs relative to the distance from the nearest gene.

