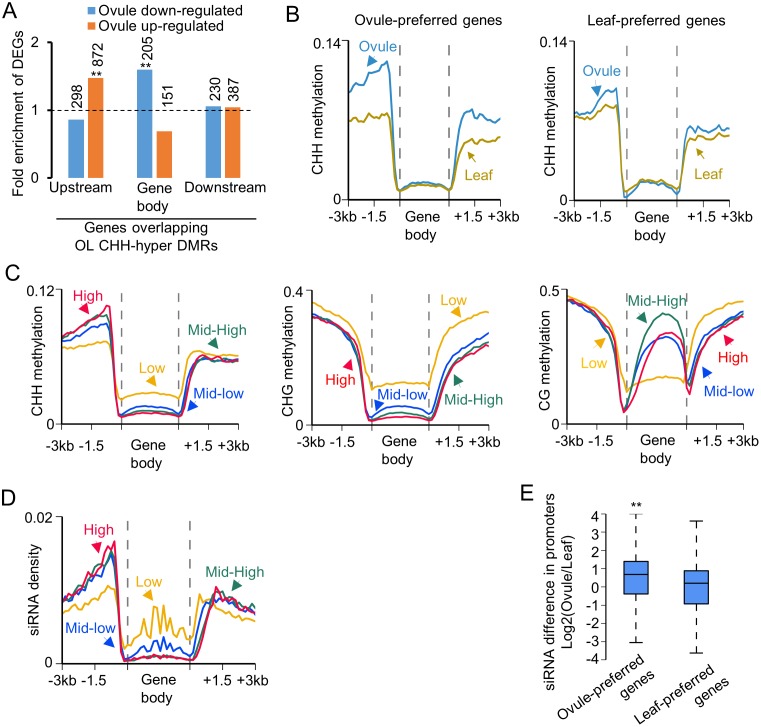
Fig 3. Relationship of ovule-leaf (OL) CHH-hyper DMRs and gene expression changes between the ovule and leaf.
(A) Fold-enrichment of differentially expressed genes (DEGs) in those overlapping with OL CHH-hyper DMRs in flanking sequences or gene body, relative to all genes. The hypergeometric test was used to infer statistical significance (*: P < 0.05; **: P < 1e-10). Numbers above columns indicate upregulated genes (orange) and down-regulated genes (blue), respectively, in the ovule, which overlapped OL CHH-hyper DMRs. (B) CHH methylation distribution in genes of ovule-preferred and leaf-preferred genes in the leaf (yellow) and ovule (blue). Leaf-preferred and ovule-preferred genes were identified by both fold-change of gene expression (> 5-fold) and ANOVA test (< 0.01). (C) Relationships between CHH (left), CHG (middle) and CG (right) methylation and expression levels of genes in ovules, which were divided into four quartiles (high, red; mid-high, green; mid-low, blue; and low, yellow). (D) The relationship between siRNA density and the genes in the four quartiles as in (C). (E) Box plot showing siRNA abundance in promoter regions of ovule-preferred (left) and leaf-preferred (right) genes.

