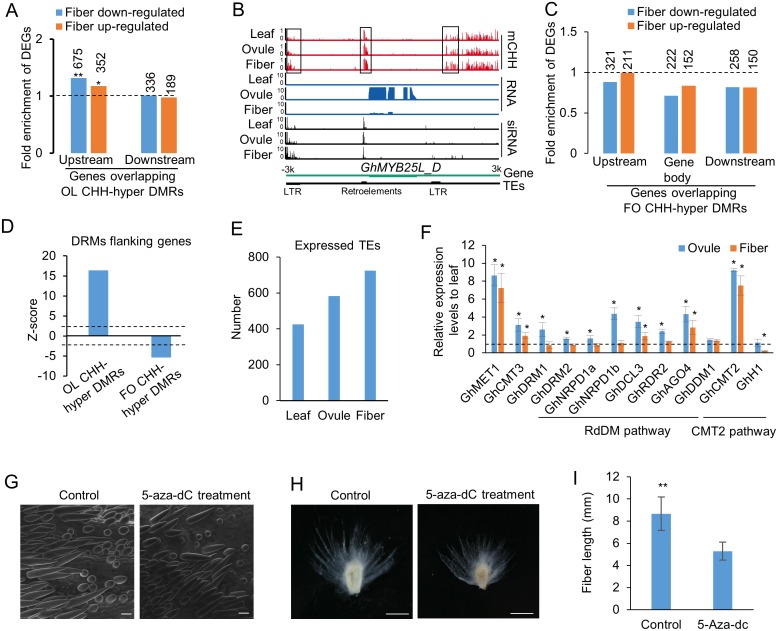
Fig 4. Influence of fiber-ovule (FO) CHH-hyper DMRs to gene expression and TE activity.
(A) Fold-enrichment of DEGs between the fiber and ovule in the genes overlapping with OL CHH-hyper DMRs, which were further hypermethylated in fibers, relative to all genes. The hypergeometric test was used to infer statistical significance (*: P < 0.05; **: P < 1e-10). Numbers above columns indicate DEGs between fiber and ovule, which overlapped OL CHH-hyper DMRs. (B) An example of fiber CHH hypermethylation correlating with gene repression in the fiber. (C) fold-enrichment of DEGs between the fiber and ovule in the genes overlapping with FO CHH-hyper DMR in the gene body and flanking sequences, relative to all genes. Numbers above columns indicate DEGs between fiber and ovule in genes, which overlapped FO CHH-hyper DMRs. (D) Enrichment (z-score) of DMRs in flanking sequences (1 kb) of genes. The dash line indicates the statistical significant level (P < 0.05). (E) Number of expressed TEs in the leaf, ovule and fiber. (F) Relative expression levels of genes related to DNA methylation in the leaf, ovule and fiber. Cotton HISTONE H3 was used as internal control for qRT-PCR analysis. The dash line indicates the expression level that is normalized to the leaf. ANOVA was used to infer statistical significance (*, P < 0.05). (G) Scanning electron micrograph (SEM) showing shorter and fewer fibers in ovules treated by 5-aza-dC. Ovules at -3—4 DPA were cultured in vitro for 4 days without (control) and with 5-aza-dC (10mg/L). (H) Shorter fibers in ovules after the aza-dC treatment for 14 days. (I) Quantitative analysis of fiber length in (H) (student’s test, p<0.01).

