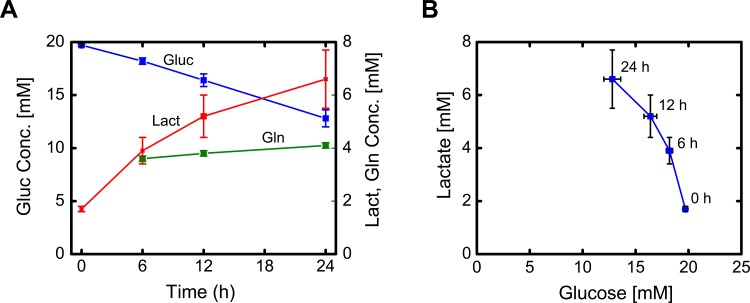
Fig 3. (A) Glucose, lactate, and glutamine concentration profiles over the course of the tracer experiment between days 6 and 7 (mean ± stdev; n = 4 biological replicates). (B) Profile of lactate concentration versus glucose concentration.
The yield of lactate on glucose decreased during the experiment as indicated by a change in the slope.

