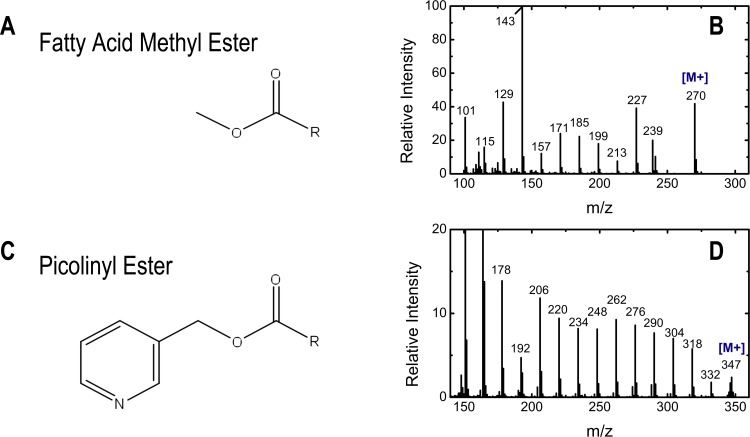
Fig 7. GC-MS analysis of fatty acid picolinyl ester derivatives.
(A) Chemical structure of fatty acid methyl ester derivatives. (B) Mass spectrum of palmitic acid (C16:0) methyl ester derivative. Intermediate mass fragments cannot be used for positional labeling information as they are not unique fragments. (C) Chemical structure of fatty acid picolinyl ester derivatives. (D) Mass spectrum of palmitic acid (C16:0) picolinyl ester derivative. The dominant fragments in the spectrum are separated by 14 amu corresponding to a unique loss of consecutive CH2 groups.

