
Fig. 3.
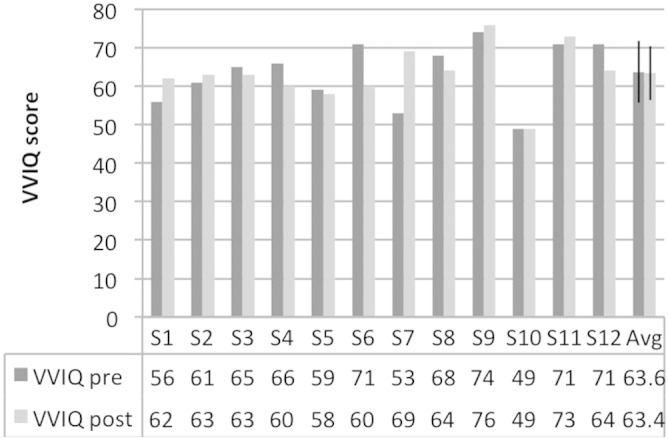
Visual Imagery Questionnaire (VVIQ) scores. VVIQ scores from before the training (pre) and after the scanning session (post) are shown for all subjects (S1 through S12). The last column shows the group averages (Avg); error bars indicate one standard deviation.