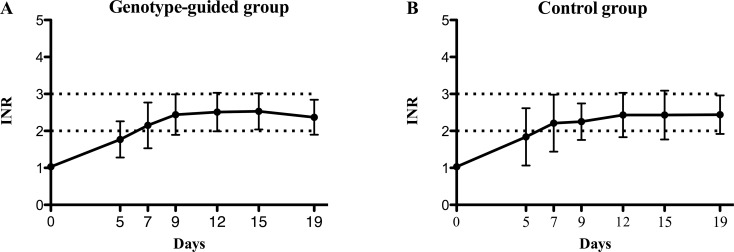
Fig 3. Overall mean INR variations according to subgroup.
Comparison of finding in the pharmacogenetic arm (section A, Genotype guided group) and control arm (section B, Control group) during the 0–19 day time frame. The bars denote Standard Deviations, the dotted lines indicate the therapeutic margins. INR = International Normalized Ratio.

