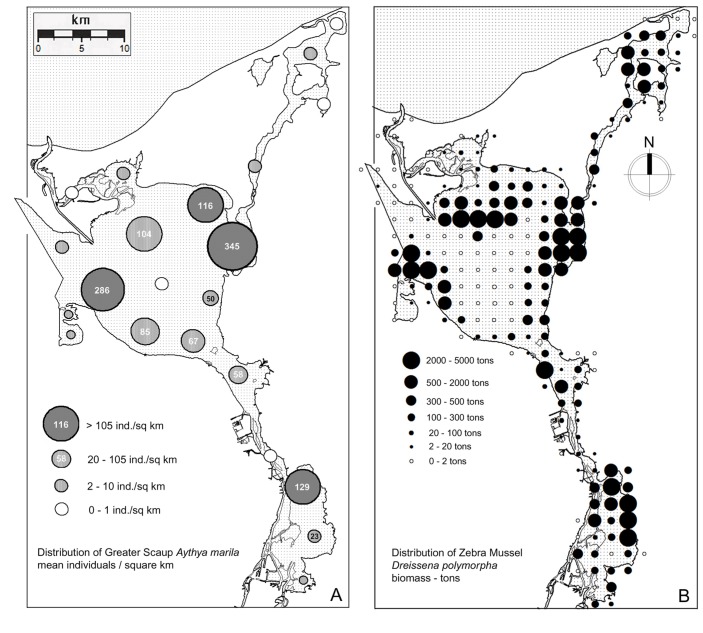
Fig 4. Spatial distribution and abundance of Greater Scaup Aythya marila–mean number of individuals per 1 km² based on censuses in the non-breeding period (October to April, 2002–2014), see also Table 2.
(A). Spatial distribution and biomass of Zebra Mussel Dreissena polymorpha on the 2x2 km modeling grid (B).

