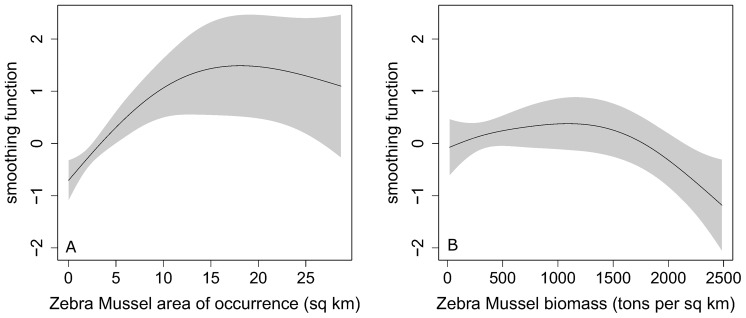
Fig 5. Estimated smoothing functions modeling Greater Scaup Aythya marila abundance in relation to the area of occurrence of Zebra Mussel Dreissena polymorpha (km2, left-hand panel– 5A) and Zebra Mussel density (tons per 1 km2, right-hand panel– 5B) from the best-supported model.
Shaded areas denote 95% confidence intervals around the smoothing functions.

