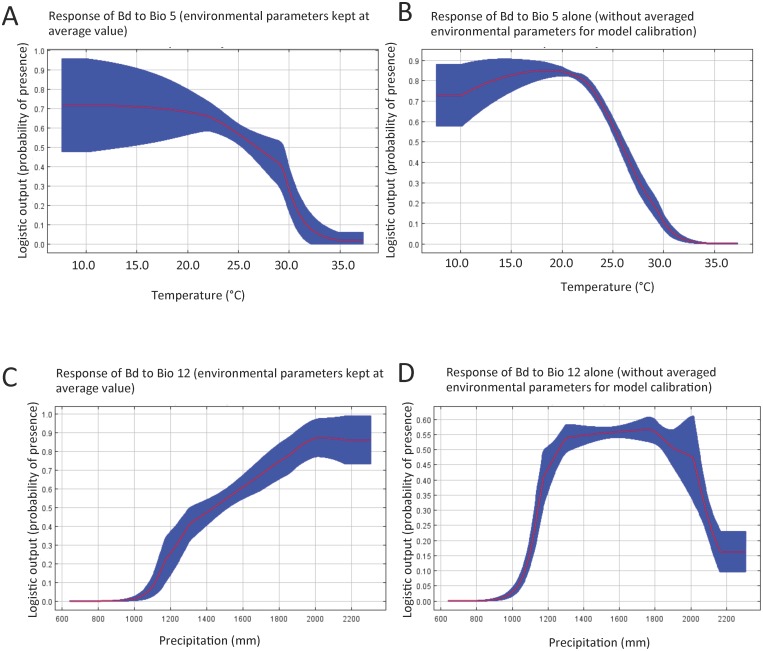
Fig 4. MaxEnt response curves illustrate how the likelihood for Bd occurrence is influenced by maximum temperature of warmest month (Bio5) and the mean annual precipitation (Bio12).
A. Shows the probability of presence of Bd as it relates to Bio5 when all other environmental variables are kept at their average values. B. Shows the same as in A, except that Bio5 alone was used for model calibration. C. Shows the probability of presence of Bd as it relates to Bio12 when all other environmental variables are kept at their average values. D. Shows the same except that Bio12 alone was used for model calibration. The red line is the mean of 100 bootstrap runs with +/- one standard deviation (blue).

