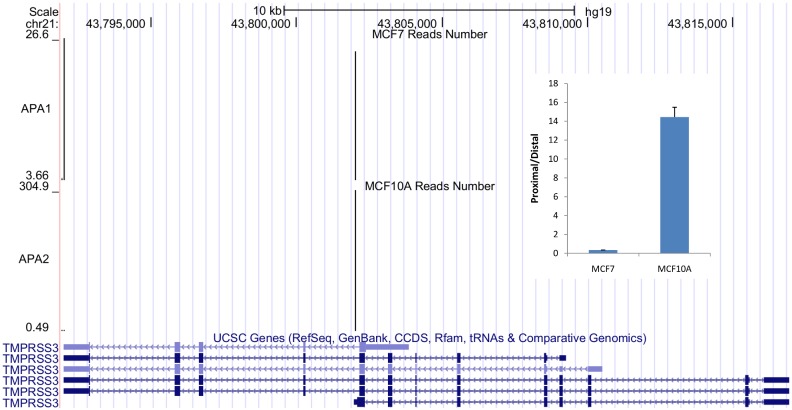
Fig 4. Comparison of TMPRSS3 poly(A) reads distribution between MCF7 and MCF10A.
MCF7 prefers to use the full length transcript compared to MCF10A. The inner graph shows qRT-PCR validation (p<0.01 with t test). Two pair of primers (proximal and distal) were used to measure the expression level of the mRNA isoforms.

