
Fig 8. Mean relative abundance of Firmicutes and Bacteroidetes and their ratio.
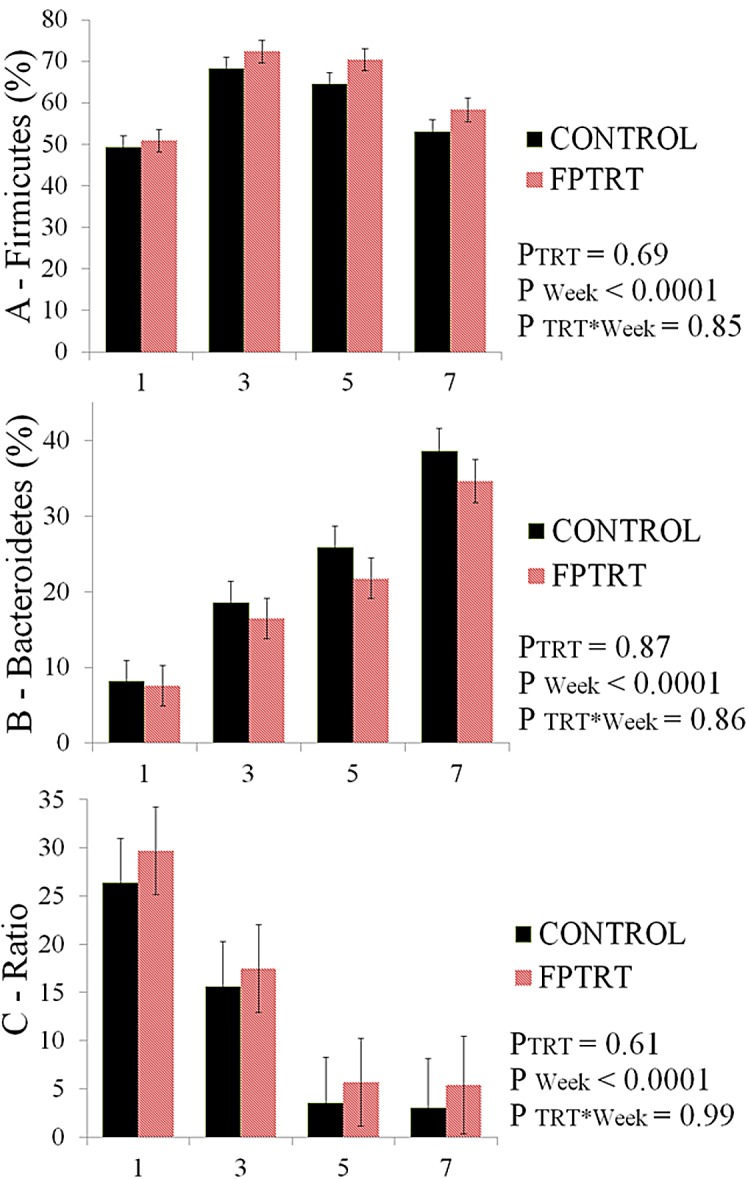
Field trial. Firmicutes mean relative abundance of control calves and FPTRT calves (A). Bacteroidetes mean relative abundance (B). Firmicutes to Bacteroidetes ratio (C). The X axis symbolizes the week of life. The Y axis represents the relative ratio (%) for A and B, and the ratio for graph C. The error bars represent standard errors of the means.