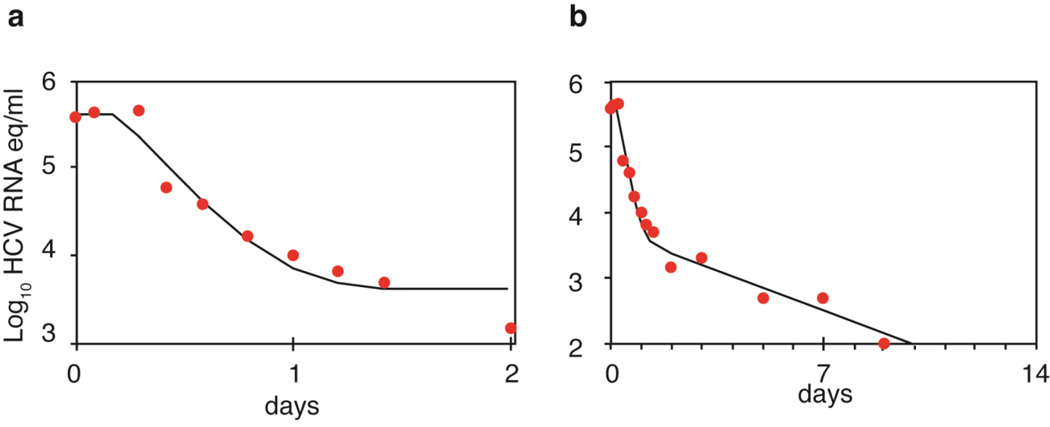
Figure 1.
Viral load decay in a patient with genotype 1 HCV treated with 15 MIU daily of IFN-α. a) Viral decline during the first 2 days of therapy as predicted by Equation 2 (solid line) plotted alongside actual data (solid circles). b) Viral decline in the same patient over the first 10 days of therapy (solid circles) and the best-fit of the Neumann et al. model6 that incorporates a second phase decline and the death of infected cells (solid line). Adapted from Neumann et al. Science 282: 103–107 (1998).

