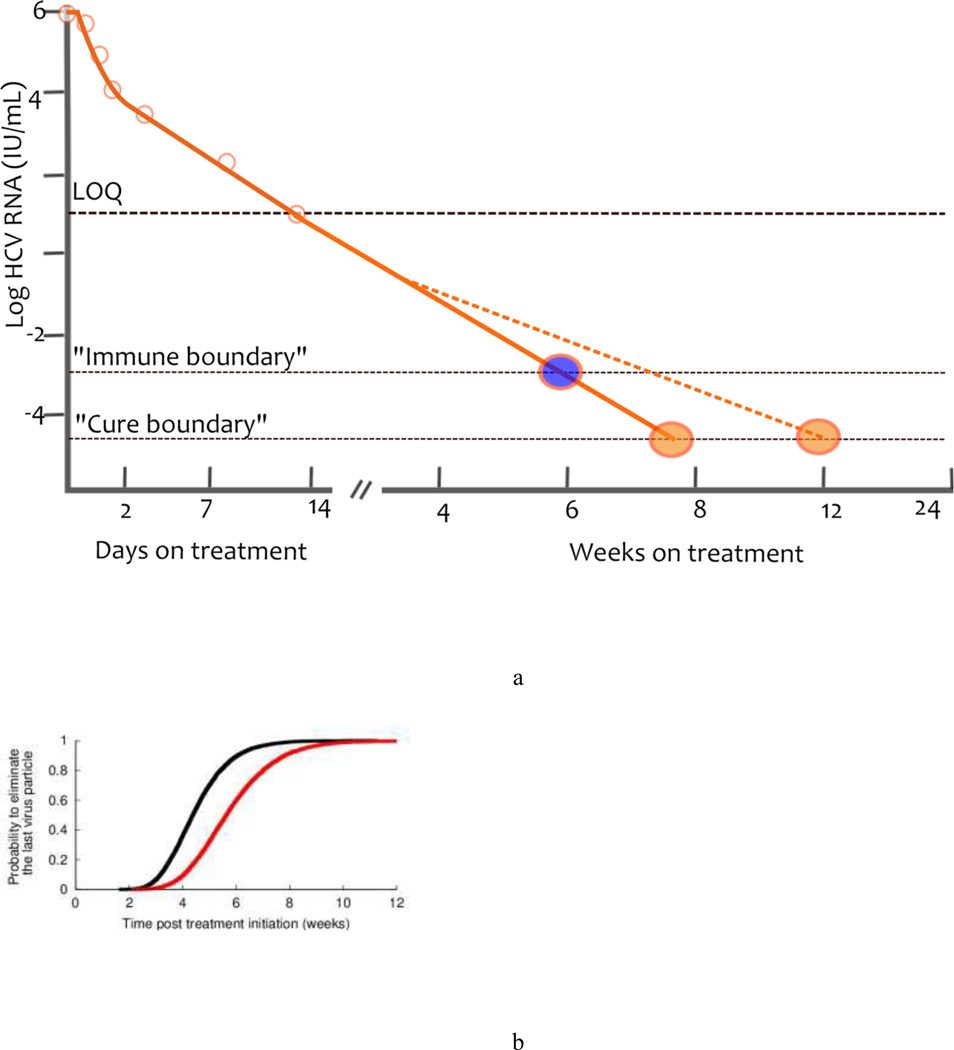
Figure 4.
Curing viral infection a) A schematic of the cure boundary. The cure boundary can be based on eliminating the last virus particle (orange circle), eliminating the last infected cell (not shown) or be a threshold beyond which the immune system can contain the infection (blue circle). In addition, when the viral load falls below the LOQ, the rate of viral decay can no longer be observed and might change in response to missed drug doses, emergence of drug resistance, viral reservoirs or other factors. Consequently the time needed to hit the cure boundary might be extended (blue dashed line). b) Estimated cumulative probability distribution function for the treatment duration needed to eliminate the last remaining virus particle. The black line corresponds to perfect treatment adherence, while the red line represents the case of partial adherence to a regime of three doses per day, where one dose is randomly missed every 2 days. Abbreviations: LOQ, limit of quantification. Reproduced with permission from Guedj et al. Hepatology 53: 1801–1808 (2011).

