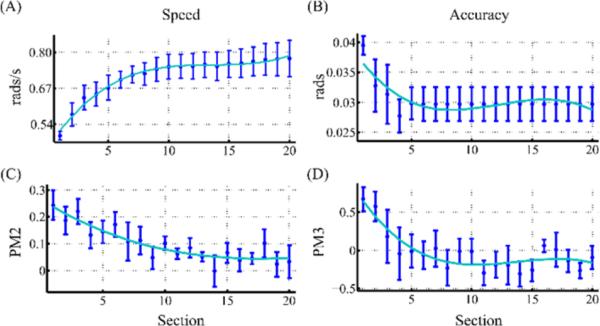
Fig. 2.
Adaptation of speed (rate of falling gates) and accuracy (target width) constraints in a single-run of Noah's Ark game. Data were averaged across 9 healthy subjects. Average (A) speed and (B) accuracy, in the ankle coordinate system and their corresponding (C) PM2 and (D) PM3. Error bars correspond to 95% confidence intervals. Cyan line corresponds to the 3rd order polynomial that best fit the average data. A single-run consisted of 20 game sections each of which had n = 10 DP movements. Gate width remained fixed after six sections. For PM3 estimation, PMz = 1.25, d = −0.25 and s = 0.4.

