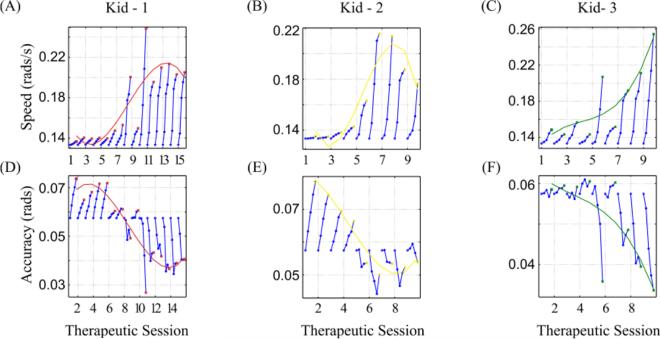
Fig. 3.
Performance curves as evidence for explicit motor learning in ankle robotic therapy. The (A, B, C) game speed and (D, E, F) accuracy constraints (target width) were adapted to each kid's performance in each of the therapeutic sessions, in DP direction. Each blue circle corresponds to the average value per section (11 movements). A 3rd order polynomial (red, yellow and green colored curve) was fit to the final value per session (indicated by colored squares).

