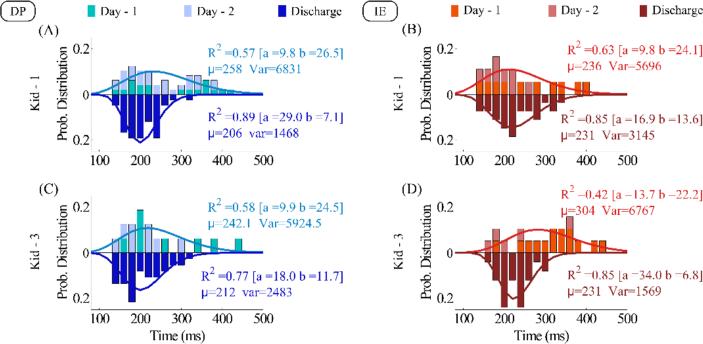
Fig. 7.
Reaction Time for (A, B) Kid-1 and (C, D) Kid-3 at admission (upper distribution) and discharge (bottom distribution) in (A, C) DP and (B, D) IE directions. For admission distributions, the data were concatenated across the first 2 days of the therapy. The gamma function with the best fit on each distribution is plotted. At discharge, the fitted mean RT became smaller for the DP than for the IE direction.

