Fig. 2.
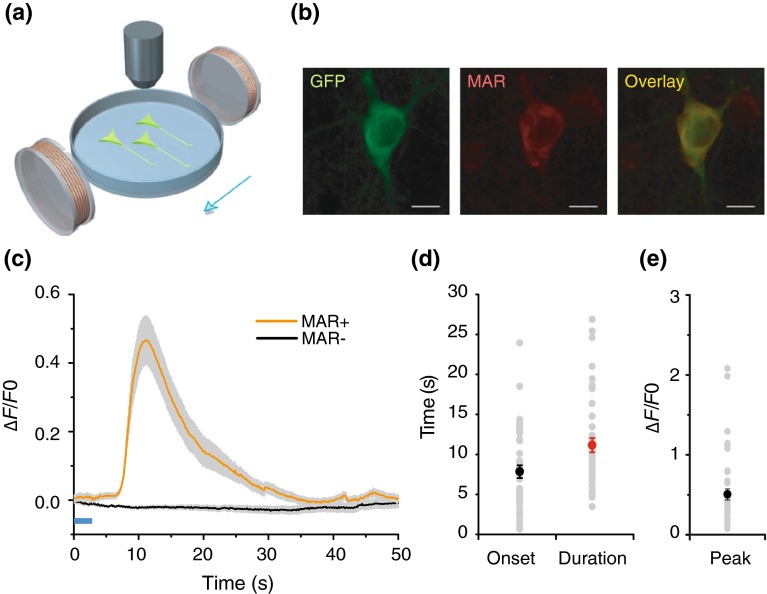
MAR enables magnetic control of neuronal activity. a Schematic of calcium imaging with hippocampal neurons cultured in Tyrode’s solution. b Confocal imaging showing co-localization of GCaMP6s and MAR. Scale bar, 10 μm. c Time course of average peak ∆F/F0 as a function of time (Solid lines indicate the mean value and shaded gray areas indicate s.e.m.). Calcium transients were only observed in MAR-transfected group. Orange, MAR group, n = 42; black, control group, n = 40. Blue bar indicates field-on. d–e Distribution of onset latency, duration, and peak ∆F/F0, respectively. Each gray dot represents result from a single neuron, while solid dots indicate mean value. Onset latency was the time interval between the magnetic field onset and the time when ∆F/F0 reached 10 % of peak ∆F/F0. Duration was measured between the time when ∆F/F0 increased to 10 % of peak value and the time when ∆F/F0 decayed to 10 % of peak ∆F/F0. Mean peak ∆F/F0 was 50.5 ± 7.0 %; mean onset latency was 7.8 ± 0.8 s; mean duration of MAR-evoked calcium transients was 11.1 ± 0.9 s. Error bar, s.e.m

