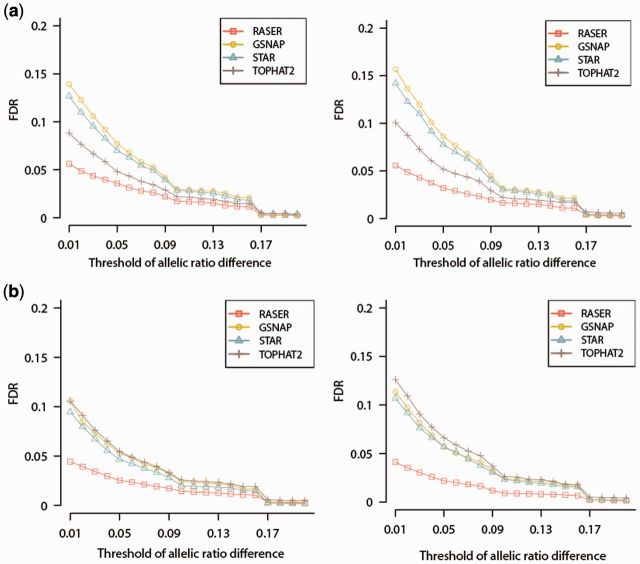
Fig. 4.
FDR in the quantification of allelic ratios of SNPs expressed in RNA-Seq. SNPs were implanted in SIM1 data of (a) 100, (b) 150 bases in length. SNPs in the YH (left panels) or GM12878 samples (right panels), both of which had corresponding whole-genome sequencing data, were implanted into the simulated reads. The ‘obviously best’ scheme was used for RASER and unique mapping was reported from the other aligners. For a specific SNP, its allelic ratio is defined as (number of reads containing the reference allele/total number of reads covering the SNP). The allelic ratio difference of this SNP is defined as the absolute difference between its observed allelic ratio and the simulated allelic ratio. At different thresholds of allelic ratio difference (0–0.2, x axis), the FDR of SNP quantification is defined as FP/(FP + TP), where FP and TP are numbers of false and true positives, respectively. At each threshold, a given SNP is defined as a true positive if its allelic ratio difference is less than the threshold; otherwise, this SNP is a false positive

