Figure 3.

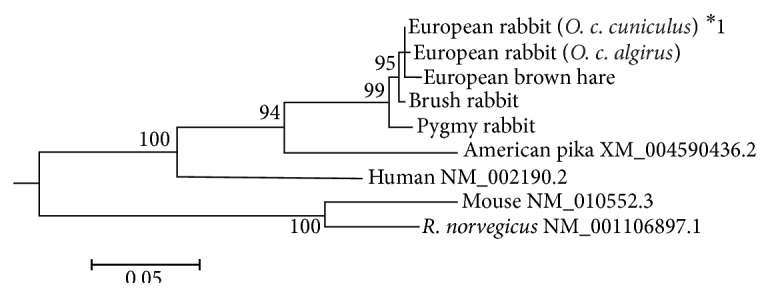
Maximum Likelihood (ML) tree of the IL17A nucleotide sequences. Only bootstrap values ≥ 94% are shown. In order to facilitate visualization, only one sequence/allele of each species was used.

Maximum Likelihood (ML) tree of the IL17A nucleotide sequences. Only bootstrap values ≥ 94% are shown. In order to facilitate visualization, only one sequence/allele of each species was used.