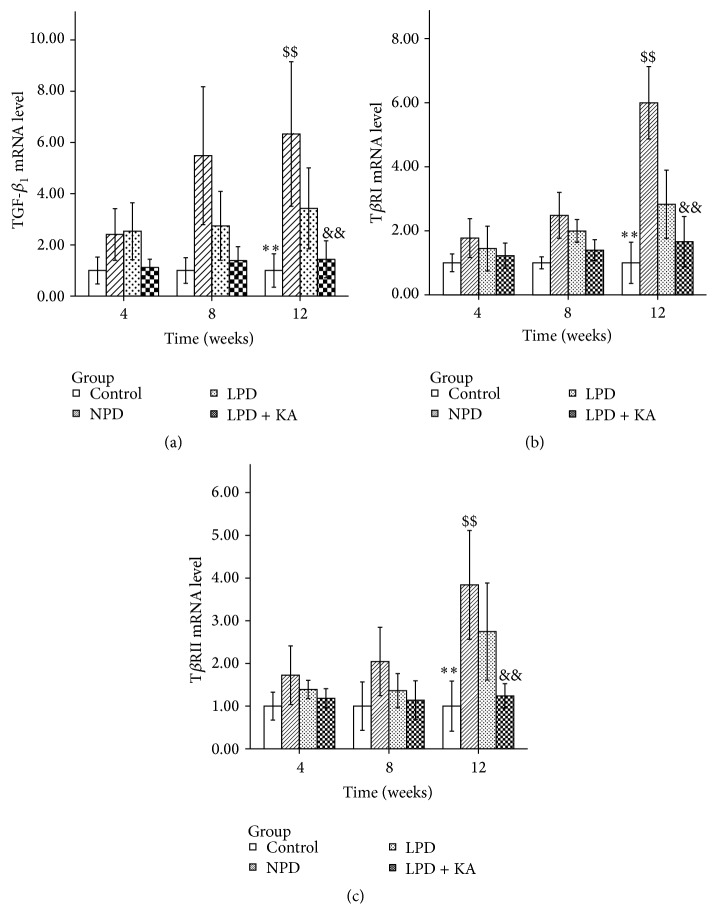
Figure 2.
mRNA expressions of TGF-β and its receptors in the experimental groups. TGF-β 1 (a), TβRI (b), and TβRII (c) mRNA levels in the kidney of the experimental groups. Data are expressed as mean ± SD; ∗∗ P < 0.05 versus NPD, LPD, and LPD + KA; $$ P < 0.01 versus LPD and LPD + KA; && P < 0.01 versus LPD. NPD: normal protein diet; LPD: low-protein diet; LPD + KA: low-protein diet supplemented with ketoacids.

