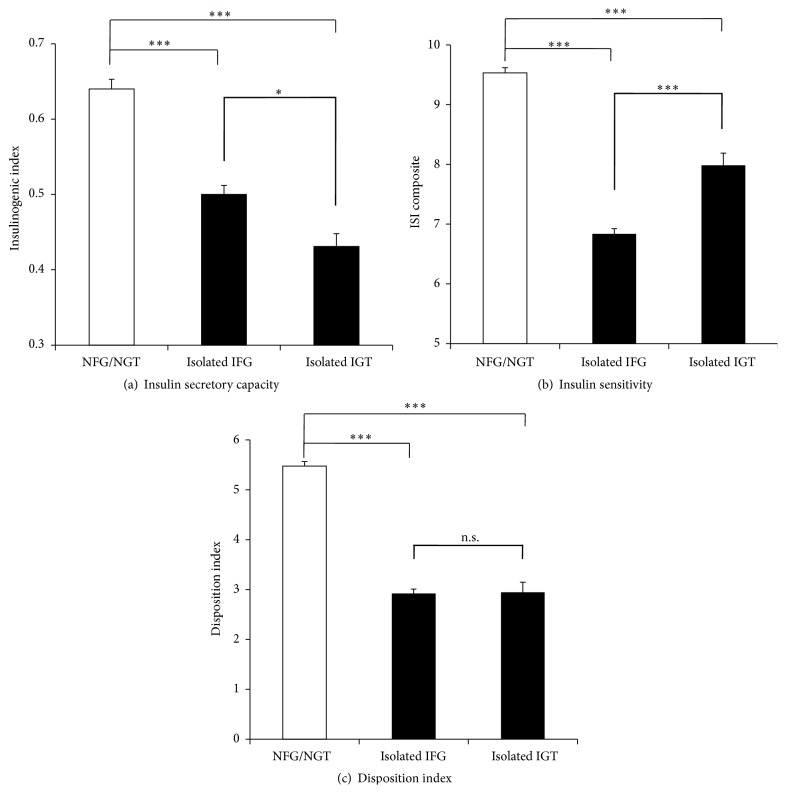
Figure 2.
(a), (b), (c) Comparison of early-phase insulin secretory capacity (a), insulin sensitivity (b), and disposition index (c) among NFG/NGT, isolated IFG, and isolated IGT. Statistical significance between two groups was represented as ∗ : p < 0.05, ∗∗∗ : p < 0.0001, and n.s.: not significant.

