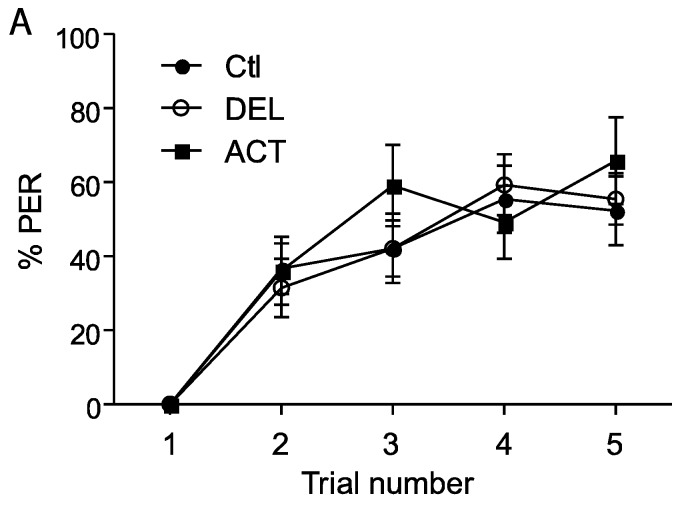
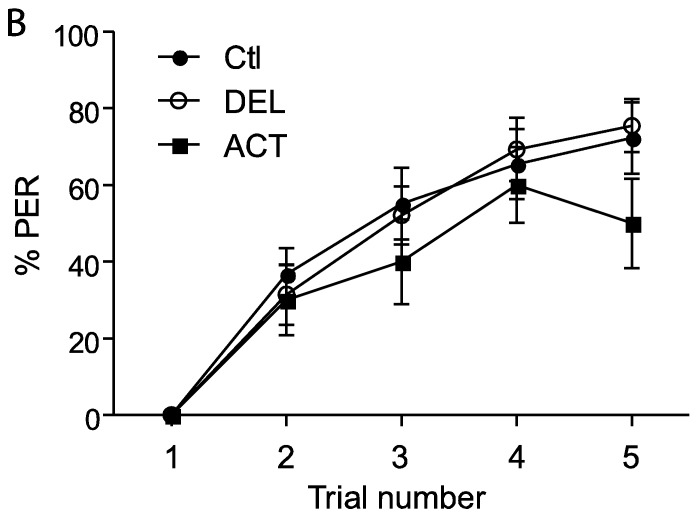
Figure 4.
PER responsiveness of honey bee when drugs were applied during learning sessions. (A,B) bees treated with 10 ng/bee or 100 ng/bee of ACT or DEL, respectively. The learning performance is expressed as the percentage of PER to antennal stimulation with 40% sucrose solution. Each group represents n = 90 bees. Bars represent standard errors. Acetamiprid (ACT), deltamethrin (DEL), and control group (Ctl).


