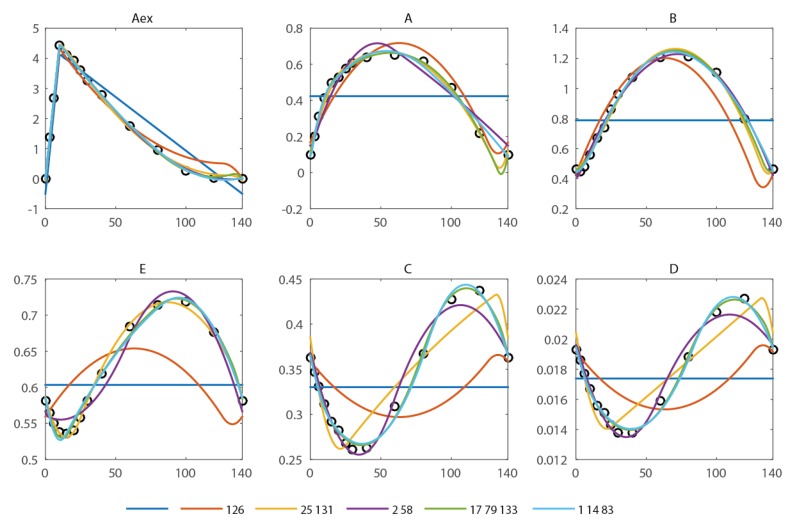
Figure 2.
Approximation of the concentration measurements using piecewise affine derivatives with 0 (blue), 1 (orange), 2 (yellow and magenta) and 3 (green and light blue) free breakpoints. The respective residual sum of squared errors can be found in Table 1.

