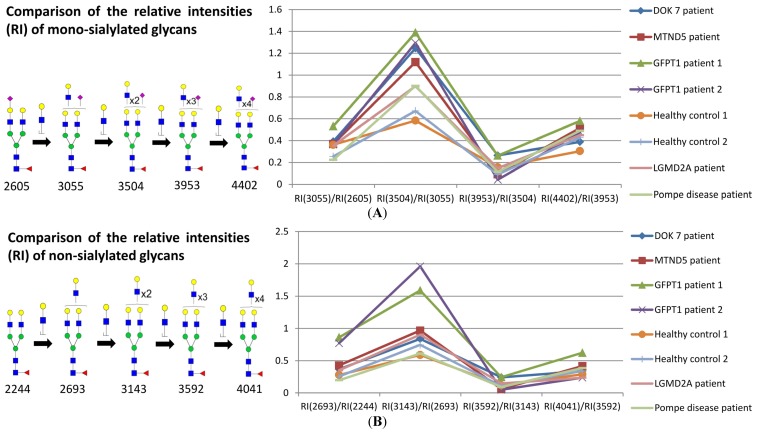
Figure 3.
Comparison of the relative intensities of a family of mono-sialylated glycans with different numbers of LacNAc (A) in myoblasts; comparison of the relative intensities of a family of non-sialylated glycans with different numbers of LacNAc (B) in myoblasts. Each point in the graph indicates a ratio which was obtained by comparing the relative intensity (RI) of one glycan to that of the corresponding glycan which possesses one fewer LacNAc moiety. The number under the glycan structure is the m/z value of the glycan; this number is increasing with the addition of LacNAc moiety. In each comparison, the numbers in the brackets correspond to the m/z of the comparing glycans.  GlcNAc,
  Man,
Man,  Gal,
Gal,  Fuc,
Fuc,  NeuAc.

