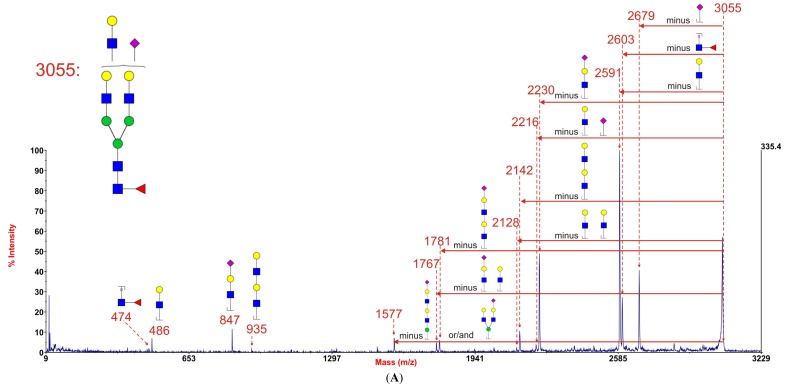
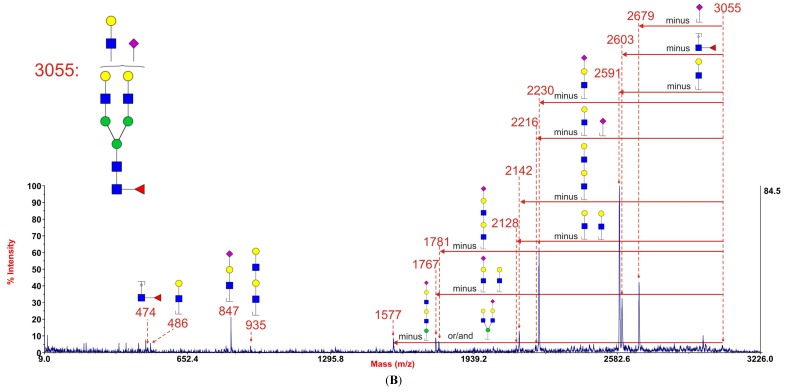
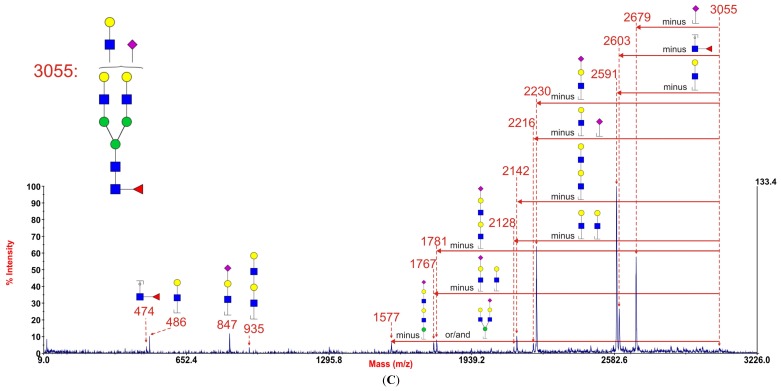
Figure 4.
MALDI-TOF/TOF MS/MS spectra of the permethylated N-glycan at m/z 3055 [M + Na]+ in myoblasts from healthy control 1 (A), GFPT1 patient 1 (B), and the DOK7 patient (C). Assignments of the fragment ions are indicated on the cartoons and on the spectra the horizontal red arrows show antennae losses whilst antennae-derived fragment ions are annotated with their sequences. The number indicated above the peak in the spectra is the m/z value of the fragment ion (resulting ion) that has been detected by the mass spectrometry.  GlcNAc,
  Man,
Man,  Gal,
Gal,  Fuc,
Fuc,  NeuAc.


